How does big data help us tackle childhood cancer?
It’s our job to break down barriers, to access and to knowledge, and put big data and powerful methods in the hands of pediatric cancer experts poised for the next big discovery. Last month, the Childhood Cancer Data Lab’s (CCDL) peer-reviewed paper, MultiPLIER: A Transfer Learning Framework for Transcriptomics Reveals Systemic Features of Rare Disease, was published by Cell Systems (Taroni et al. 2019.). MultiPLIER is a machine learning approach that brings big data to bear on rare diseases. It’s also an example of the scientific approach and ethos of the CCDL, and the publication is a great opportunity to share how the CCDL is developing new technologies to accelerate research into cures for childhood cancers!
What kind of data and why did we use it?
There are many ways to measure biological samples, and these produce different types of data. In the context of MultiPLIER, “big data” refers to a type of data called transcriptomic or gene expression data. These are measurements of the collection of RNA molecules in a sample. Before we go too much further, let’s talk about why this matters.
There is something called the central dogma of molecular biology (if this gets too deep into biology jargon, fear not, the next paragraph has an example with baked goods 🧁🧁🧁), which says that DNA gives rise to RNA which gives rise to protein. Our genetic material, DNA, is made up in part by genes that encode proteins. Proteins are what do most of the work in our cells, tissues, and ultimately organs. They’re responsible for carrying out essential molecular processes like creating energy, forming structures, and signaling between different parts of our bodies. RNA is an intermediate step between DNA and proteins. A copy of RNA or a transcript (messenger RNA to be specific) is made from the DNA template when a cell needs a protein to make a structure, to transmit a signal, or to carry out a process. When this happens, we refer to this as the gene being transcribed or expressed. This is where the terms transcriptomic or gene expression arise from. We call the collection of DNA and proteins the genome and proteome, respectively. Measuring RNA gives us a snapshot of what cells are doing and is a powerful tool to gain insight into the biology of cancers. Such measurements have led to prognostic tests in adult cancers (e.g., the Prosigna Breast Cancer Prognostic Gene Signature Assay).
To use my favorite central dogma analogy (because cupcakes 🧁):
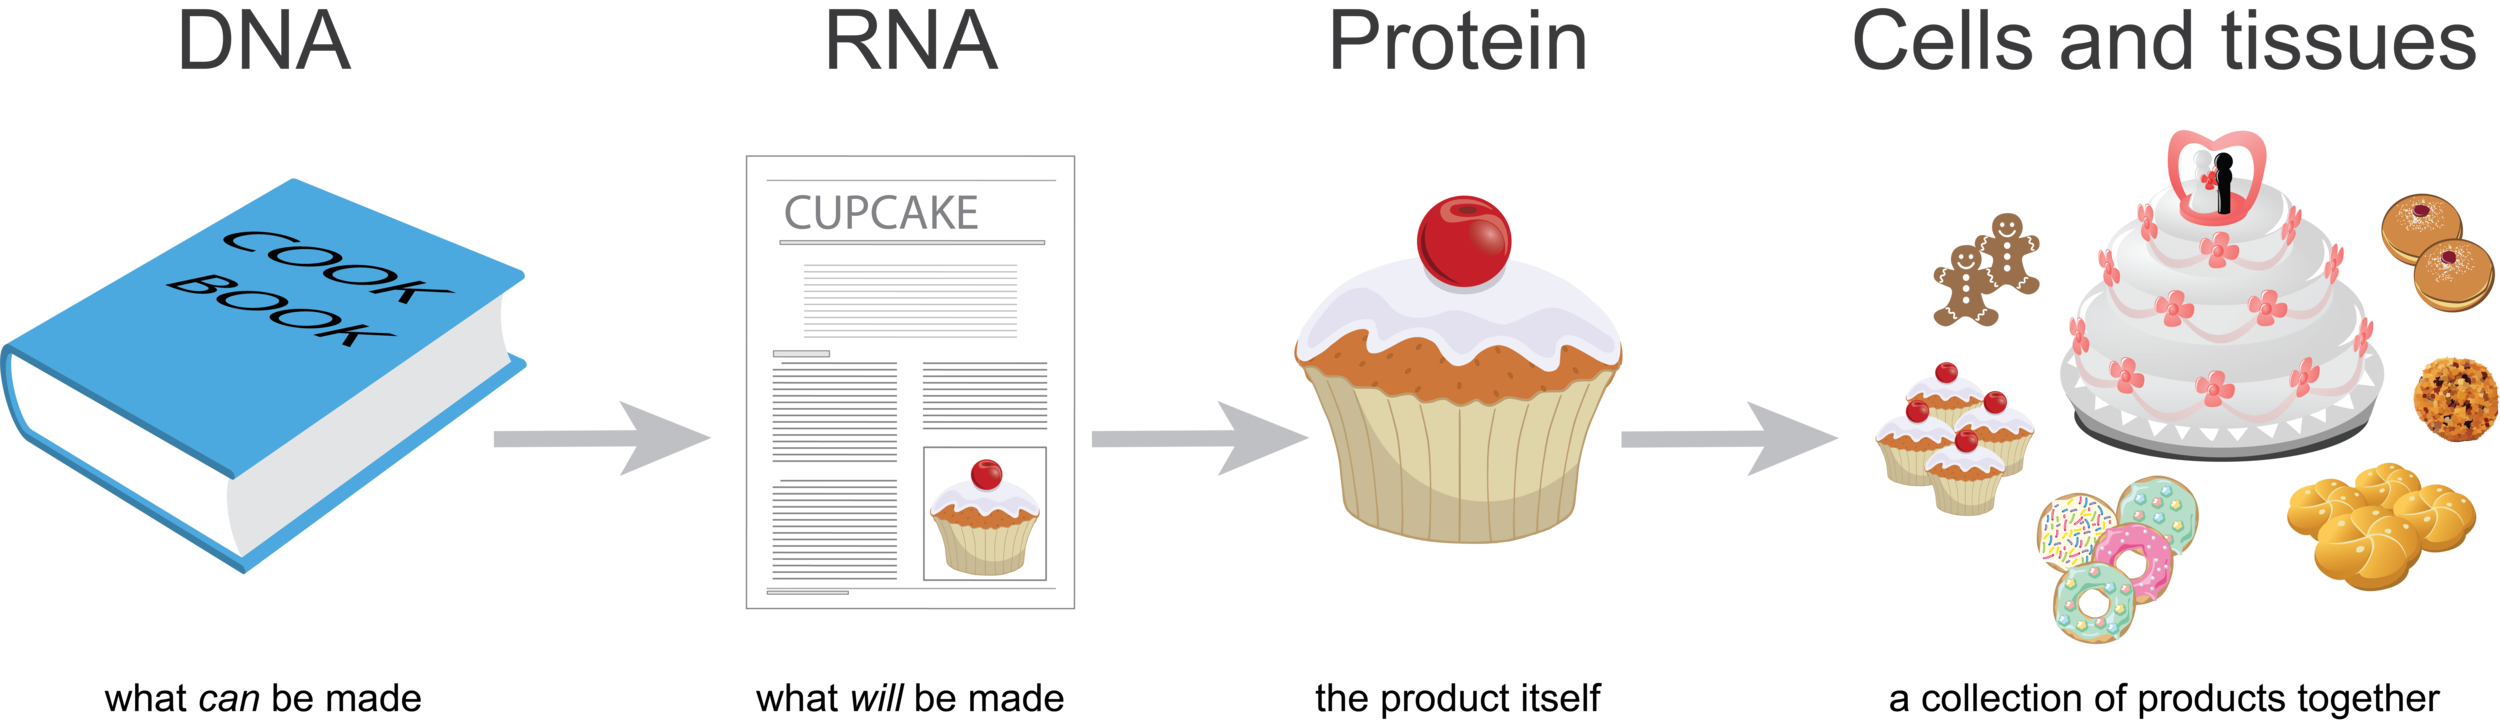
DNA is like a cookbook; it contains information about every product you could make. RNA is a like a recipe; it is how to make a particular product. Proteins are like cupcakes—the product itself. You can think of cells or tissues like a bakery, a collection of products together.
Imagine that for every individual product (cupcake) you make, you’d make a copy of the recipe. So if you were to look at all the recipes in the bakery at one point in time, you’d be able to guess what was being made. If there were many more copies of the wedding cake recipe than the cupcake recipe on the counters, you’d guess that there were lots of weddings that week.
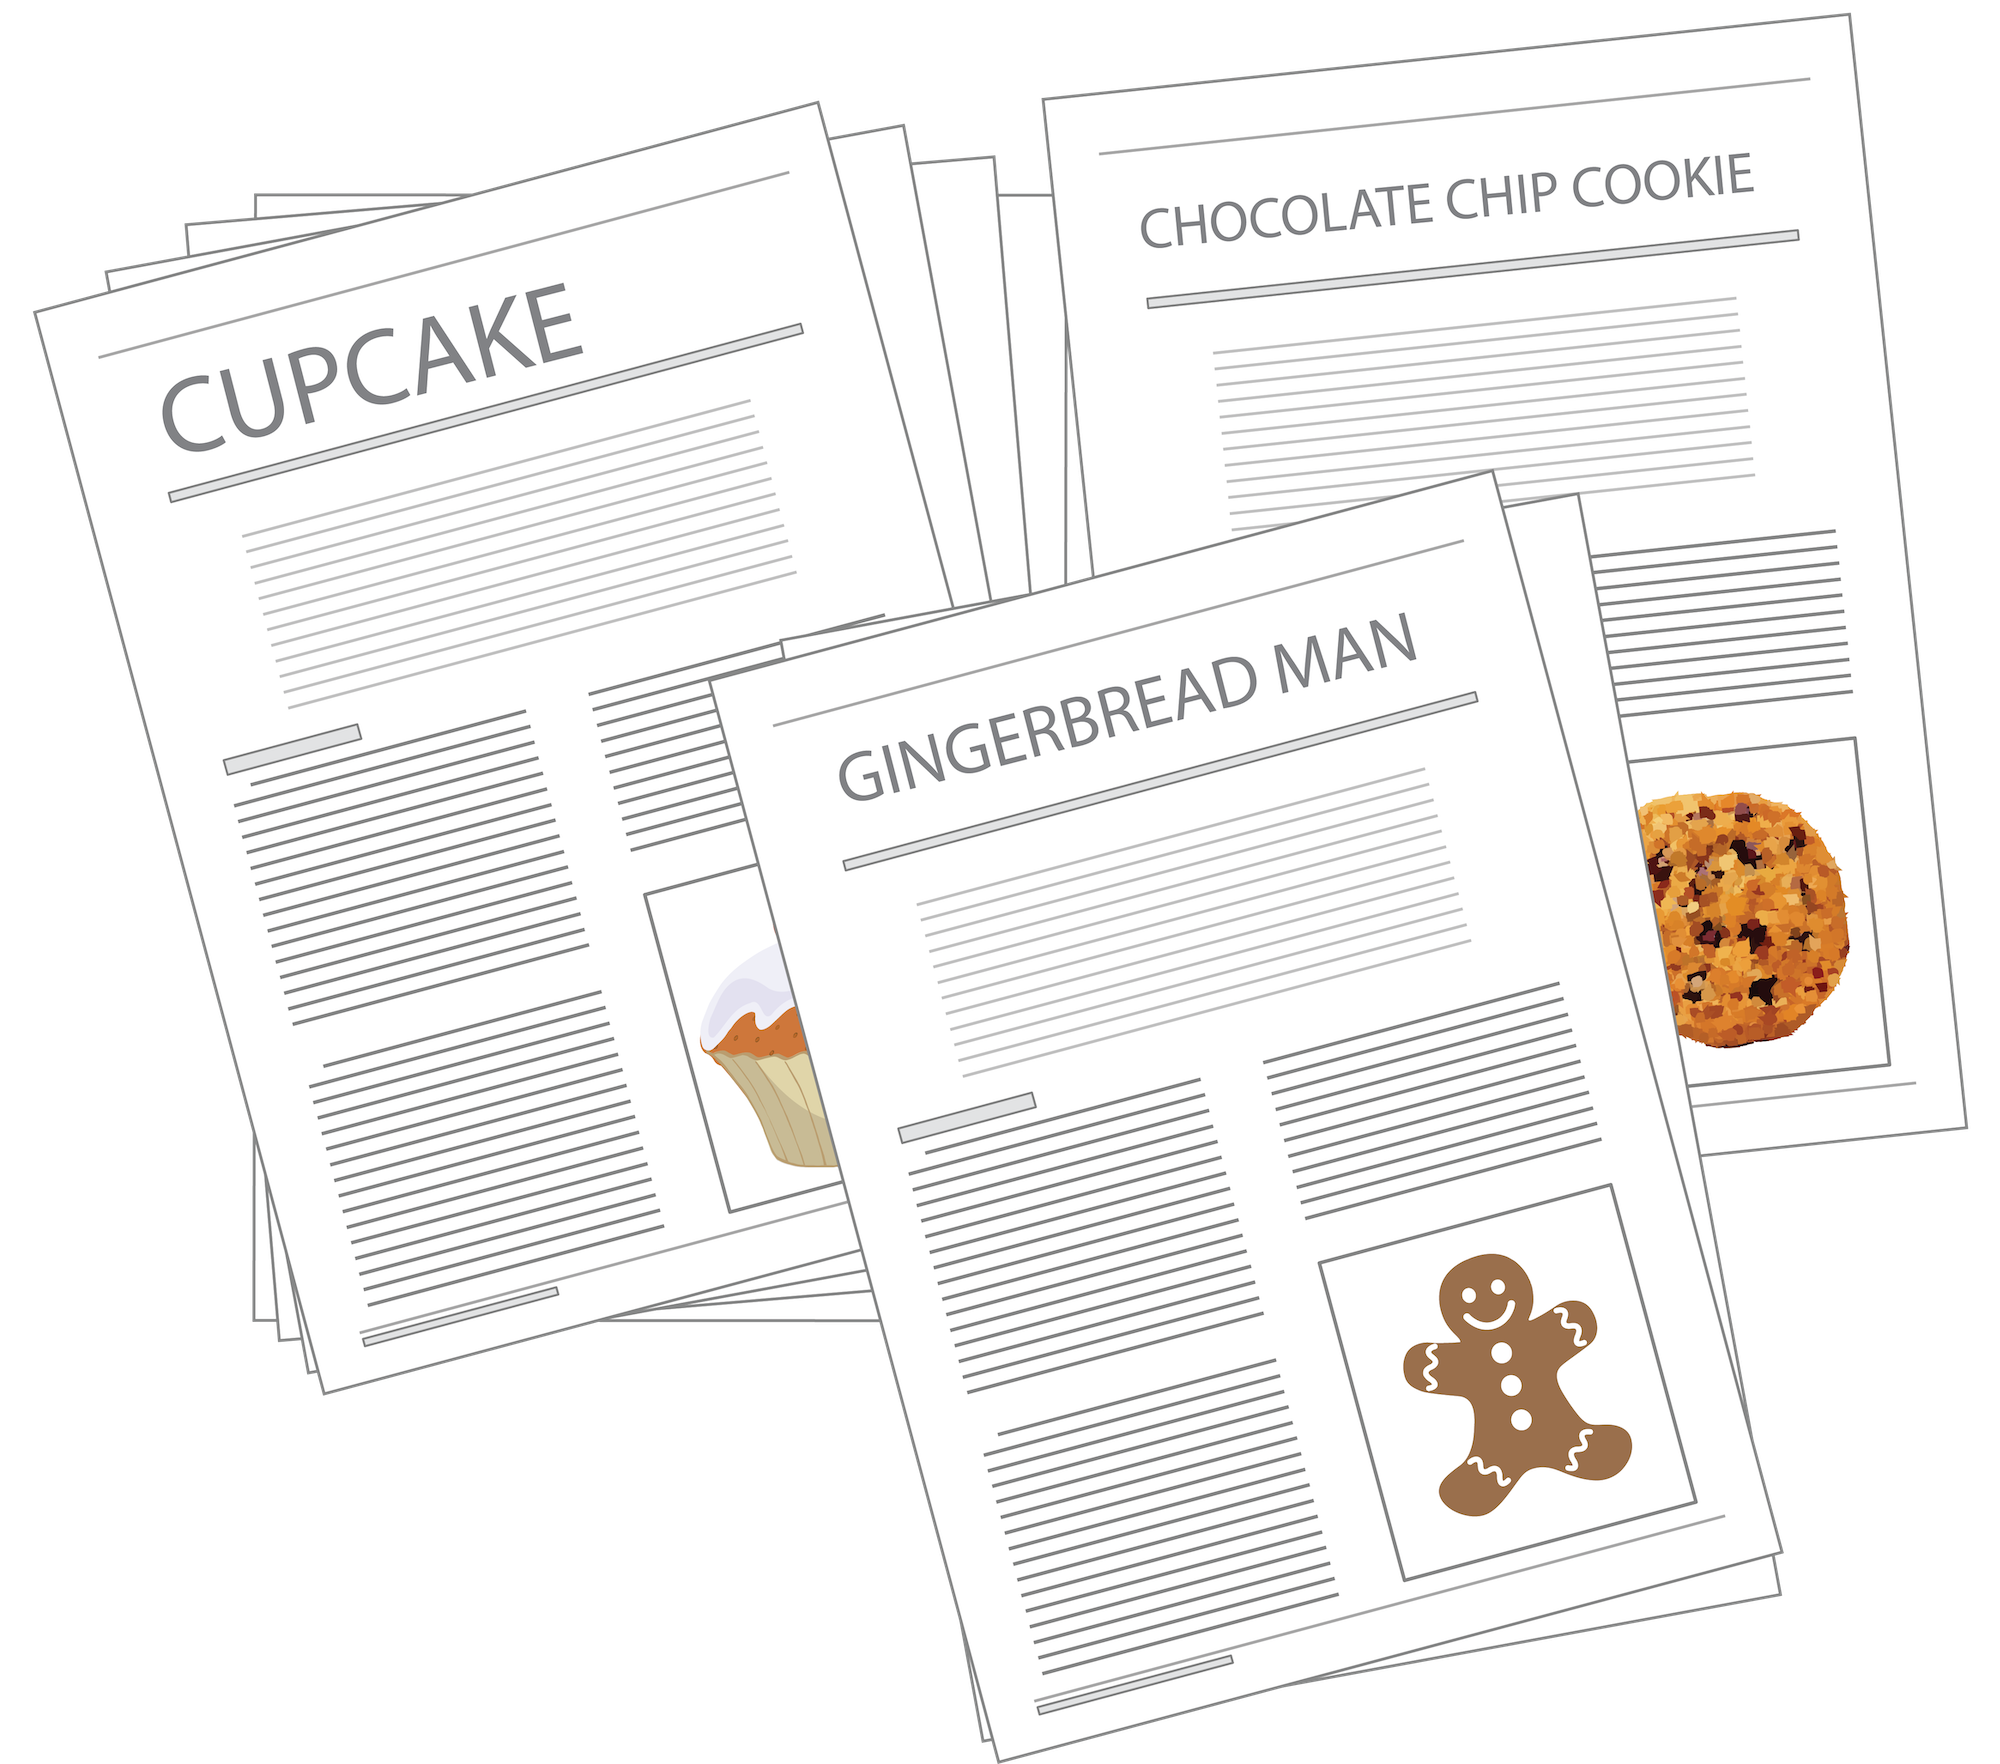
When we look at genome-wide gene expression data, we’re looking at the collection of recipes, RNA, at the time of sampling. Proteins do not usually work alone. Rather, they often work together as parts of complex pathways or processes. A baked cupcake isn’t quite ready for prime time if it doesn’t have its icing. If many of the genes that encode proteins for a particular process are expressed in a tissue (the cupcake AND the icing), we guess that this process is active in this tissue. With MultiPLIER we can extract patterns from genome-wide gene expression data (if we have a large enough sample size; more on that below). This provides a snapshot of the processes that are happening in a tissue, which could be a tumor at the time of biopsy.
MultiPLIER is a more powerful method to study rare diseases
When studying childhood cancers, we’ve faced two major challenges that MultiPLIER addresses:
- Individual childhood cancer diagnoses are rare diseases. This limits the sample size for an individual study. It is difficult to find important patterns in small datasets.
- Multiple datasets = multiple models. For example, we often compare results across groups of patients from different institutions because results that show up repeatedly are more likely to be true. This is time consuming and limits the number of studies that we can look at.
We show in the peer-reviewed paper that the MultiPLIER strategy learns many more pathways than analysis of individual datasets. This means that it provides a higher resolution view into what's happening in a disease. Also, because we learn a single model, which we can then apply across datasets, we no longer have to do that time-consuming comparison step.
Brief Aside - What is a MultiPLIER model? The standard approach to using tools like PLIER is to extract patterns from single datasets. For MultiPLIER, we train a machine learning model using a method called PLIER (Mao et al. bioRxiv. 2017.) on as many datasets as we have available to us (Multi-dataset PLIER, or MultiPLIER for short), even if the datasets come from completely different diseases than what we want to study. The output of PLIER is patterns of genes that tend to vary together in their expression levels. When we trained the MultiPLIER model, a couple of things might have happened. We might have found that training over different datasets muddled all of the signals and so we got less resolution than with individual datasets. Alternatively, we might have found that we got high resolution, but not for the pathways and processes relevant for the diseases we wanted to study. Fortunately, what we ended up with was a model that provided higher resolution than PLIER provided for analyses within a single dataset or disease and also one that described the features, like a neutrophil signature, of rare diseases—even when those rare diseases weren’t provided to the model during training.
Validation, simplified
In the past when we’ve studied pathways across datasets, we had to perform an analysis within each dataset and then compare across them. MultiPLIER has many uses, but one that we’re excited about is that it provides a single model that can be applied across many datasets. Going back to the bakery analogy, it’s like we can now show up at any bakery and while just glancing through the window, we can get a quick summary of the relative quantities of cupcakes, cookies, and wedding cakes. The MultiPLIER model smooths out differences in the individual shops and lets us focus on the important differences.
For example, we were able to identify concordance between two medulloblastoma cohorts, Robinson et al. and Northcott et al., with relative ease—check out the figure below. (As a side note for those who know a bit about gene expression platforms, the MultiPLIER model was trained entirely on RNA-seq data, and the medulloblastoma datasets are measured on the older microarray technology; the approach is able to overcome the cross-technology noise). We could quickly study the role of pathways across medulloblastoma subtypes in two different datasets.
Our comparisons are not limited to different cohorts examining the same disease. We could also study these patterns across multiple pediatric cancers, which is a direction we are now exploring. MultiPLIER is a tool that makes it much faster to do the robust work of multi-dataset comparisons that are so essential to finding new targets or vulnerabilities of rare cancers!
MultiPLIER and the CCDL ethos
Some of the parts that make me most proud of the work we did with the MultiPLIER project are things that we don’t always talk about as members of the scientific community. However, these same parts are intrinsic to the spirit of the CCDL.
It’s important to us at the CCDL that we’re bringing tools and conceptual advances to the study of pediatric cancers. The MultiPLIER project would have been impossible, full stop, without the work of other scientists. In particular, we owe a great deal of gratitude to the scientists who shared their gene expression data publicly, researchers who built recount2 (Collado-Torres et al. Nature Biotechnology. 2017.), which we used as training data for the MultiPLIER model, and the authors of PLIER (Mao et al. bioRxiv. 2017.).
We made all of our code and models from this project open, easy to access, and easy to build upon via permissive licensing. You can take a look at all the code here: https://github.com/greenelab/multi-plier. You can even see our negative results—the things that didn’t work. This helps other researchers understand when this approach may fail for them and can save them time they would have invested in the research equivalent of a dead-end. We know folks are already using this approach for their research because we’ve communicated with and helped them along the way.
What’s next?
The resources underlying MultiPLIER, recount2 and PLIER, were set up for studying human data (at least at the inception of the project). We know that if we are to discover new treatments for childhood cancers, we’ll also need to draw on studies in model organisms because these systems are powerful tools for probing biological processes or screening compounds. We’ve been building refine.bio with childhood cancers in mind: we’re processing gene expression samples from model organisms such as zebrafish and mouse, and because these diseases are rare we’re processing both microarray and RNA-seq samples to unlock as much data as possible. We’ve also developed strategies to make it easier to use PLIER with model organisms (see this notebook). We’re looking forward to trying the MultiPLIER approach in zebrafish to study models of pediatric cancer, and we’re excited to see where other researchers take this next.
It’s our job to break down barriers, to access and to knowledge, and put big data and powerful methods in the hands of pediatric cancer experts poised for the next big discovery. Last month, the Childhood Cancer Data Lab’s (CCDL) peer-reviewed paper, MultiPLIER: A Transfer Learning Framework for Transcriptomics Reveals Systemic Features of Rare Disease, was published by Cell Systems (Taroni et al. 2019.). MultiPLIER is a machine learning approach that brings big data to bear on rare diseases. It’s also an example of the scientific approach and ethos of the CCDL, and the publication is a great opportunity to share how the CCDL is developing new technologies to accelerate research into cures for childhood cancers!
What kind of data and why did we use it?
There are many ways to measure biological samples, and these produce different types of data. In the context of MultiPLIER, “big data” refers to a type of data called transcriptomic or gene expression data. These are measurements of the collection of RNA molecules in a sample. Before we go too much further, let’s talk about why this matters.
There is something called the central dogma of molecular biology (if this gets too deep into biology jargon, fear not, the next paragraph has an example with baked goods 🧁🧁🧁), which says that DNA gives rise to RNA which gives rise to protein. Our genetic material, DNA, is made up in part by genes that encode proteins. Proteins are what do most of the work in our cells, tissues, and ultimately organs. They’re responsible for carrying out essential molecular processes like creating energy, forming structures, and signaling between different parts of our bodies. RNA is an intermediate step between DNA and proteins. A copy of RNA or a transcript (messenger RNA to be specific) is made from the DNA template when a cell needs a protein to make a structure, to transmit a signal, or to carry out a process. When this happens, we refer to this as the gene being transcribed or expressed. This is where the terms transcriptomic or gene expression arise from. We call the collection of DNA and proteins the genome and proteome, respectively. Measuring RNA gives us a snapshot of what cells are doing and is a powerful tool to gain insight into the biology of cancers. Such measurements have led to prognostic tests in adult cancers (e.g., the Prosigna Breast Cancer Prognostic Gene Signature Assay).
To use my favorite central dogma analogy (because cupcakes 🧁):
DNA is like a cookbook; it contains information about every product you could make. RNA is a like a recipe; it is how to make a particular product. Proteins are like cupcakes—the product itself. You can think of cells or tissues like a bakery, a collection of products together.
Imagine that for every individual product (cupcake) you make, you’d make a copy of the recipe. So if you were to look at all the recipes in the bakery at one point in time, you’d be able to guess what was being made. If there were many more copies of the wedding cake recipe than the cupcake recipe on the counters, you’d guess that there were lots of weddings that week.
When we look at genome-wide gene expression data, we’re looking at the collection of recipes, RNA, at the time of sampling. Proteins do not usually work alone. Rather, they often work together as parts of complex pathways or processes. A baked cupcake isn’t quite ready for prime time if it doesn’t have its icing. If many of the genes that encode proteins for a particular process are expressed in a tissue (the cupcake AND the icing), we guess that this process is active in this tissue. With MultiPLIER we can extract patterns from genome-wide gene expression data (if we have a large enough sample size; more on that below). This provides a snapshot of the processes that are happening in a tissue, which could be a tumor at the time of biopsy.
MultiPLIER is a more powerful method to study rare diseases
When studying childhood cancers, we’ve faced two major challenges that MultiPLIER addresses:
- Individual childhood cancer diagnoses are rare diseases. This limits the sample size for an individual study. It is difficult to find important patterns in small datasets.
- Multiple datasets = multiple models. For example, we often compare results across groups of patients from different institutions because results that show up repeatedly are more likely to be true. This is time consuming and limits the number of studies that we can look at.
We show in the peer-reviewed paper that the MultiPLIER strategy learns many more pathways than analysis of individual datasets. This means that it provides a higher resolution view into what's happening in a disease. Also, because we learn a single model, which we can then apply across datasets, we no longer have to do that time-consuming comparison step.
Brief Aside - What is a MultiPLIER model? The standard approach to using tools like PLIER is to extract patterns from single datasets. For MultiPLIER, we train a machine learning model using a method called PLIER (Mao et al. bioRxiv. 2017.) on as many datasets as we have available to us (Multi-dataset PLIER, or MultiPLIER for short), even if the datasets come from completely different diseases than what we want to study. The output of PLIER is patterns of genes that tend to vary together in their expression levels. When we trained the MultiPLIER model, a couple of things might have happened. We might have found that training over different datasets muddled all of the signals and so we got less resolution than with individual datasets. Alternatively, we might have found that we got high resolution, but not for the pathways and processes relevant for the diseases we wanted to study. Fortunately, what we ended up with was a model that provided higher resolution than PLIER provided for analyses within a single dataset or disease and also one that described the features, like a neutrophil signature, of rare diseases—even when those rare diseases weren’t provided to the model during training.
Validation, simplified
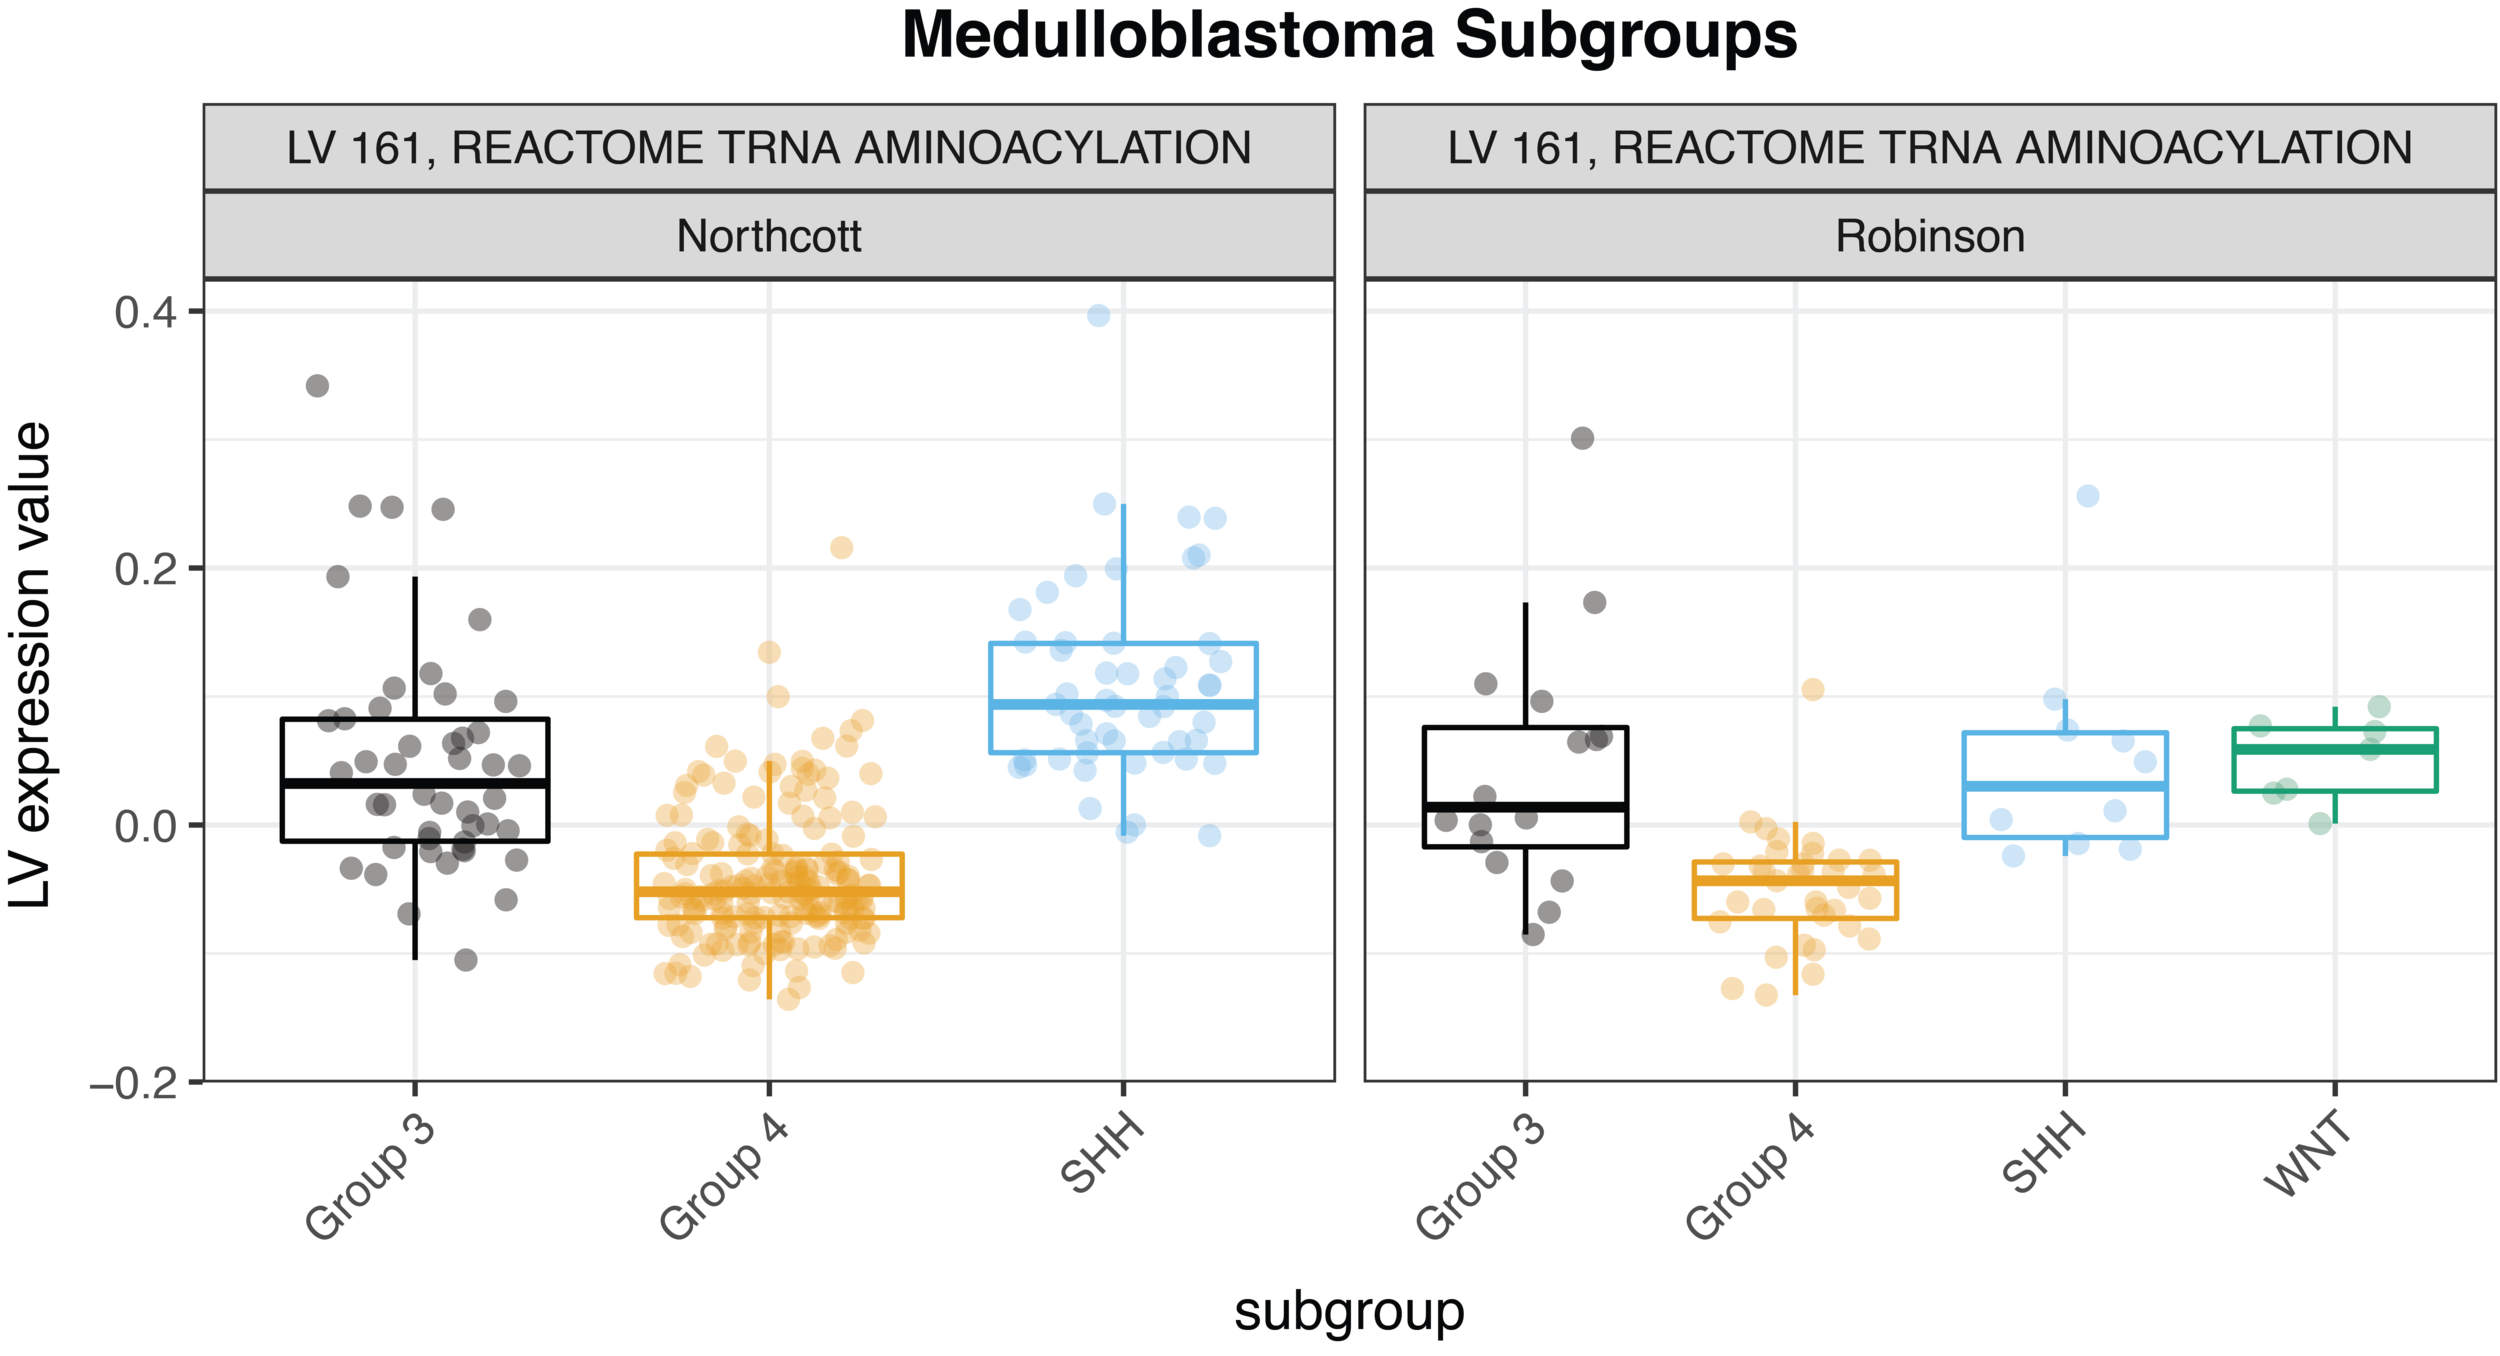
In the past when we’ve studied pathways across datasets, we had to perform an analysis within each dataset and then compare across them. MultiPLIER has many uses, but one that we’re excited about is that it provides a single model that can be applied across many datasets. Going back to the bakery analogy, it’s like we can now show up at any bakery and while just glancing through the window, we can get a quick summary of the relative quantities of cupcakes, cookies, and wedding cakes. The MultiPLIER model smooths out differences in the individual shops and lets us focus on the important differences.
For example, we were able to identify concordance between two medulloblastoma cohorts, Robinson et al. and Northcott et al., with relative ease—check out the figure below. (As a side note for those who know a bit about gene expression platforms, the MultiPLIER model was trained entirely on RNA-seq data, and the medulloblastoma datasets are measured on the older microarray technology; the approach is able to overcome the cross-technology noise). We could quickly study the role of pathways across medulloblastoma subtypes in two different datasets.
Our comparisons are not limited to different cohorts examining the same disease. We could also study these patterns across multiple pediatric cancers, which is a direction we are now exploring. MultiPLIER is a tool that makes it much faster to do the robust work of multi-dataset comparisons that are so essential to finding new targets or vulnerabilities of rare cancers!
MultiPLIER and the CCDL ethos
Some of the parts that make me most proud of the work we did with the MultiPLIER project are things that we don’t always talk about as members of the scientific community. However, these same parts are intrinsic to the spirit of the CCDL.
It’s important to us at the CCDL that we’re bringing tools and conceptual advances to the study of pediatric cancers. The MultiPLIER project would have been impossible, full stop, without the work of other scientists. In particular, we owe a great deal of gratitude to the scientists who shared their gene expression data publicly, researchers who built recount2 (Collado-Torres et al. Nature Biotechnology. 2017.), which we used as training data for the MultiPLIER model, and the authors of PLIER (Mao et al. bioRxiv. 2017.).
We made all of our code and models from this project open, easy to access, and easy to build upon via permissive licensing. You can take a look at all the code here: https://github.com/greenelab/multi-plier. You can even see our negative results—the things that didn’t work. This helps other researchers understand when this approach may fail for them and can save them time they would have invested in the research equivalent of a dead-end. We know folks are already using this approach for their research because we’ve communicated with and helped them along the way.
What’s next?
The resources underlying MultiPLIER, recount2 and PLIER, were set up for studying human data (at least at the inception of the project). We know that if we are to discover new treatments for childhood cancers, we’ll also need to draw on studies in model organisms because these systems are powerful tools for probing biological processes or screening compounds. We’ve been building refine.bio with childhood cancers in mind: we’re processing gene expression samples from model organisms such as zebrafish and mouse, and because these diseases are rare we’re processing both microarray and RNA-seq samples to unlock as much data as possible. We’ve also developed strategies to make it easier to use PLIER with model organisms (see this notebook). We’re looking forward to trying the MultiPLIER approach in zebrafish to study models of pediatric cancer, and we’re excited to see where other researchers take this next.
Related Post
Are you attending the American Association for Cancer Research (AACR) Annual Meeting in San Diego, CA? Visit us in the exhibit hall at booth 2918 from April 19-22, 2026, and during poster sessions. Meet Data Lab team members and learn about ALSF grant opportunities, resources for pediatric cancer research, and apply to free data science training workshops!
Applications are open for the Data Lab's upcoming workshop, which will cover advanced topics in the analysis of single-cell RNA-seq data for researchers studying pediatric cancer. The course will be held virtually from June 8-12, 2026 from 12-5pm Eastern time.
The Data Lab will be holding a virtual workshop, Introduction to Single-cell RNA-Sequencing, from May 11-15, 2026! In this workshop, Data Lab staff will introduce researchers studying pediatric cancer to the R programming language, the Tidyverse R packages for data science, single-cell RNA-seq data analysis, and annotating cell types.
Exciting news from the Single-cell Pediatric Cancer Atlas (ScPCA) Portal! All datasets on the portal have been updated to include several new features that enhance data quality and usability. Here’s a close look at what we’ve added and why.
It's that time of year again – it's time to start a new research project! Planning for the research itself can be daunting, but planning for your work to be fully reproducible is a whole other layer that isn't always emphasized. In this blog post, we'll outline a few project organization principles we teach in our Reproducible Research Practices workshop that we think are really helpful for ensuring reproducibility (among other benefits!).
At the Childhood Cancer Data Lab, we support pediatric cancer researchers by providing data science training, collaborating on data-intensive projects, and designing open-source tools. Through this work, we’ve had the opportunity to engage with scientists who are applying rigorous, data-driven approaches to address some of the most pressing challenges in childhood cancer.
Applications are open for the Data Lab's upcoming workshop, which will cover advanced topics in the analysis of single-cell RNA-seq data for researchers studying pediatric cancer. The course will be held virtually from December 8-12, 2025 from 12-5pm Eastern time.
At the Childhood Cancer Data Lab, we’re committed to helping pediatric cancer researchers work more efficiently, collaboratively, and reproducibly. That’s why we created our Reproducible Research Practices workshop, first piloted in 2022 with six participants. Since then, more than 50 pediatric cancer researchers have joined us to learn hands-on techniques for achieving reproducible results in computational cancer research. This fall, we’re excited to hold the next workshop in Philadelphia, PA!
The Data Lab recently traveled to California to lead a hands-on workshop for nine researchers from the UC Santa Cruz Treehouse Childhood Cancer Initiative. The participants, all from a range of backgrounds and experience levels, came together to learn common practices for reproducible computational research. Our relationship with Treehouse spans years, grounded in a shared commitment to open science and reproducibility. This workshop was a chance to strengthen that partnership and an opportunity to put shared values into practice!
Use cases define how users interact with a product or system, including actions users can take and how the system responds. It also identifies user goals and paths for the system to handle errors.
The Open Single-cell Pediatric Cancer Atlas (OpenScPCA) project is one year old, and there is much to celebrate! For the past year, we’ve worked closely with pediatric cancer experts to analyze data from the ScPCA Portal, improving its utility for researchers everywhere. Our focus has been on adding reliable cell type annotations across samples on the Portal, but the journey has been much more than that.
The Data Lab will be holding a virtual workshop, Introduction to Single-cell RNA-Sequencing, from August 4-8, 2025! In this workshop, Data Lab staff will introduce researchers studying pediatric cancer to the R programming language, the Tidyverse R packages for data science, single-cell RNA-seq data analysis, and annotating cell types.
Applications are open for the Data Lab's next training workshop! We will cover advanced topics in the analysis of single-cell RNA-seq data for researchers studying pediatric cancer. The 3-day course will take place June 10-12, 2025 from 9am-5pm Eastern time in Bala Cynwyd, PA, just outside of Philadelphia.
Before we launched OpenScPCA, we had to outline the process for contributing to analyses and then document that process for others. In addition, when designing the process for contributing to the project, we made sure to implement strategies to ensure reproducibility over the life cycle of the project. After planning and documenting expectations for contributors, we prepared to launch our first call for contributions, where we asked pediatric cancer experts to help us assign cell type annotations for all samples on the Portal. We thought it would be helpful to have an existing analysis module that other contributors could reference, so we picked a member of our science team (it’s me, hi 👋) to go through the process of developing an analysis module.
Are you attending the American Association for Cancer Research (AACR) Annual Meeting in Chicago, IL? Visit us in the exhibit hall at booth 3706 from April 27-30, 2025, and during poster sessions. We have exciting news about grant opportunities, projects, free training workshops, and more!
In 2023, we launched our first-ever call for contributions to the Single-cell Pediatric Cancer Atlas (ScPCA) Portal, inviting the research community to share their data. This initiative has been instrumental in expanding the Portal, with numerous pediatric cancer researchers responding to the call and collaborating with us to make more data available. Today, the Portal holds data from 700 samples across 55 cancer types, and we look forward to increasing those numbers with our latest call for contributions.
We are excited to announce that our next virtual workshop, Introduction to Single-cell RNA-Seq, will run from March 24-28,2025! In this workshop, Data Lab staff will introduce researchers studying pediatric cancer to the R programming language, the Tidyverse R packages for data science, single-cell RNA-seq data analysis, and annotating cell types.
Launching the Open Single-cell Pediatric Cancer Atlas (OpenScPCA) project in April 2024 was a highlight of our year! This community-driven initiative aims to analyze data from the ScPCA Portal, which currently holds 700 samples from over 55 pediatric cancer types. The project is a step forward in advancing our knowledge of pediatric cancers through single-cell analysis, and we're excited to expand OpenScPCA in 2025! To that end, we're reflecting on some of our recent accomplishments and how we can keep that momentum going into next year.
When the Data Lab launched the Single-cell Pediatric Cancer Atlas (ScPCA) Portal in 2022, we knew it was only the beginning! We started by making data easily available for the research community and received an overwhelmingly positive response. But we know firsthand from training hundreds of pediatric cancer researchers in analysis that making data available is just the first step. We’re increasing the impact of the Portal by listening to the growing ScPCA community. Now more researchers can contribute datasets, new features are continuously being developed, and we started an open, collaborative project to further explore the available data! Here’s a look back at how we’ve enhanced the ScPCA Portal in 2024.
In our last blog post, we shared some of the tools and methods we are using in the Open Single-cell Pediatric Cancer Atlas (OpenScPCA) project to ensure that the analysis code remains usable and runnable throughout the project. That post mainly focused on some of the most dynamic phases of the project, when contributors are adding new analysis modules and updating existing ones with more refined results. Here, we will discuss the test data that enables the methods and our approach to running the full set of analyses on real data.
Applications are open for the Data Lab's next training workshop! We will cover advanced topics in the analysis of single-cell RNA-seq data for researchers studying pediatric cancer. The 3-day course will take place December 10-12, 2024 from 9am-5pm Eastern time in Bala Cynwyd, PA, just outside of Philadelphia.
Earlier this year, we launched the Open Single-cell Pediatric Cancer Atlas (OpenScPCA) project, a collaborative project to openly analyze the data in the Single-cell Pediatric Cancer Atlas Portal on GitHub. We hope this project will bring transparently and expertly assigned cell type labels to the data in the Portal, help the community understand the strengths and limitations of applying existing single-cell methods to pediatric cancer data, and, frankly, allow us to meet more scientists in our community working with single-cell data (maybe you? 😄).
Recently, the Data Lab packed up and headed to the University of Minnesota (UMN) to host a workshop for 19 researchers. Participants with a variety of skill levels and backgrounds joined us from UMN, St. Jude Children’s Research Hospital, the Mayo Clinic, and the Medical University of South Carolina.
Applications are open for the Data Lab's next workshop! We will hold a Reproducible Research Practices Course on October 23-24, 2024 in Milwaukee, WI. Instructors will introduce principles and techniques to achieve reproducible results in computational cancer research. We’ll show you the fundamentals of commonly used approaches in reproducibility that you can apply to increase the impact of your research by making your findings more robust and reliable! To ensure that workshop attendees have a great hands-on experience, a very limited number of seats will be available.
We are excited to announce our next workshop, Introduction to Bulk RNA-Sequencing and Reproducible Research Practices, will take place in Minneapolis, MN from August 19-22, 2024! In this workshop, Data Lab staff will introduce researchers studying pediatric cancer to the R programming language, the Tidyverse R packages for data science, bulk RNA-seq data analysis, pathway analyses, and techniques to achieve reproducible results in computational cancer research.
In April 2024, we announced the Open Single-cell Pediatric Cancer Atlas (OpenScPCA) project. Since then, we’ve been working to build a supportive community while getting started on a few analysis ideas! We’re excited to see growing interest in the project, and we have some big news for prospective collaborators.
So you recently did some single-cell RNA sequencing and are working on analyzing your data. You’ve already quantified the gene expression data, performed any filtering, and normalized your data, but now what? You know you want to perform differential expression analysis or that you need to annotate the cell types found in your data, but there are so many different tools and methods for performing these analyses. How do you know which one is the best method for your dataset? Don’t worry, we’ve all been there – even experts in the single-cell field have been there.
The Open Single-cell Pediatric Cancer Atlas (OpenScPCA) is an open, collaborative project to analyze data from the Single-cell Pediatric Cancer Atlas (ScPCA) Portal, which currently holds over 500 samples from over 50 pediatric cancer types. OpenScPCA uses an open contribution model designed to allow experts worldwide to contribute and rapidly share the results of analyses in real time. The project was officially launched in April 2024.
In March 2022, we launched the Single-cell Pediatric Cancer Atlas (ScPCA) Portal to make uniformly processed single-cell and single-nuclei RNA-Seq data widely available to the childhood cancer research community. Initially, all data available on the Portal was generated through grants funded by Alex’s Lemonade Stand Foundation (ALSF) as part of the ScPCA project. But enabling access to ALSF-funded data was just the beginning of our vision.Sharing is key to ensuring the Portal’s continued growth. Our sights were set on allowing more pediatric cancer researchers to contribute data to the ScPCA Portal.
The Data Lab has just launched the brand new Open Single-cell Pediatric Cancer Atlas (OpenScPCA) project! This open, collaborative project aims to analyze data from the ScPCA Portal, which currently holds 500 samples from over 50 pediatric cancer types. We are seeking contributors with diverse skills and expertise to join the project!
We are excited to announce that our next virtual workshop, Introduction to Single-cell RNA-Seq, will run from June 10-14, 2024! In this workshop, Data Lab staff will introduce researchers studying pediatric cancer to the R programming language, the Tidyverse R packages for data science, single-cell RNA-seq data analysis, and annotating cell types.
Applications are open for the Data Lab's next workshop! We are holding a two-day course on Reproducible Research Practices and the Open Single-cell Pediatric Cancer Atlas (OpenScPCA) project from May 14-15, 2024. Please note that the OpenScPCA module is an optional part of the workshop. The course begins with an introduction to principles and techniques to achieve reproducible results in computational cancer research. On day two, you can choose to continue the workshop and learn how to put your skills to use for OpenScPCA, our new pediatric cancer research project.
Are you attending the American Association for Cancer Research (AACR) annual meeting in San Diego, CA? Visit the Alex’s Lemonade Stand Foundation (ALSF) Grants and Data Lab teams at booth 3755 in the exhibit hall from April 7-10 and during poster sessions on April 8. We will announce a new collaborative project and share exciting news about the Single-cell Pediatric Cancer Atlas Portal and training opportunities!
Did you know that 70% of the Alex’s Lemonade Stand Foundation (ALSF) Childhood Cancer Data Lab team are currently women? Advancing our mission to empower childhood cancer researchers with knowledge, data, and tools would not be possible without their expertise. On the International Day of Women and Girls in Science, we are excited to introduce you to these women who integrate science, engineering, and design to tackle some of the greatest challenges faced by the pediatric cancer research community!
I have a confession to make: I am lazy. Ok, maybe that's too strong. Let's go for a euphemism instead: I am efficient. I love learning handy tricks that make my life easier and make my job smoother with fewer hiccups along the way. This is one part of why, here in the Data Lab, we love automation - why waste our time on rote, repetitive, housekeeping tasks when we can get the bots to do it for us? In this blog post, we'll highlight a few tips about how you can use RStudio to code more efficiently.
Writing source code is a significant part of data-intensive biomedical research. Everything from cleaning and pre-processing data to generating publication figures can be accomplished programmatically. Increasingly, funding agencies and journals require researchers to share their code. To pick a few examples, the Data Lab’s parent organization, Alex’s Lemonade Stand Foundation (ALSF), has such a requirement for awardees, and PLoS Computational Biology requires authors to make code underlying results and conclusions available.
There is an old joke in computer science about how there are only two hard things: cache invalidation, naming things, and off-by-one errors. I’ll leave aside the first one as beyond my own expertise, but the second comes up all the time in my work as a biological data scientist. Naming variables and functions in my code is a constant struggle, but one I have to deal with on my own or with my team. Much bigger problems come up when trying to deal with all the various ways that people across the world use names when talking about the diseases they work on, the types of cells they are looking at, the experimental methods they are using, and just about every other aspect of their studies.
Applications are open for the Data Lab's next workshop! We will be holding a Reproducible Research Practices Course in-person on October 24-25, 2023. Instructors will introduce principles and techniques to achieve reproducible results in computational cancer research. We’ll show you the fundamentals of commonly-used approaches in reproducibility that you can apply to increase the impact of your research by making your findings more robust and reliable! To ensure that workshop attendees have a great hands-on experience, there will be a very limited number of seats available.
At the Center for Data-Driven Discovery in Biomedicine (D3b), I lead the Bioinformatics Translational Pediatric Oncology Team, a team of bioinformatics scientists. Our mission is to advance pediatric oncology research and precision medicine through collaboration and development of open-source analytical tools, frameworks, and data resources. In 1998, I lost my four year old cousin John Matthew to a brain tumor we now know was likely a diffuse intrinsic pontine glioma. So, it was bittersweet for me to see the Open Pediatric Brain Tumor Atlas (OpenPBTA) manuscript published in Cell Genomics on the last day of brain tumor awareness month this past year. But let’s rewind.
Writing effective documentation is challenging. Users might not always read every word in the documentation. They might even just scroll past large chunks of text, but we can accommodate those behaviors by structuring and formatting content appropriately.
In 2019, Alex’s Lemonade Stand Foundation (ALSF) established the Single-cell Pediatric Cancer Atlas (ScPCA) through awards for data generation and to create an atlas of single-cell gene expression profiles of pediatric cancers of different types and from different organ sites. The Data Lab launched the ScPCA Portal in 2022 to make uniformly processed, summarized single-cell and single-nuclei RNA-seq data and de-identified metadata available for download. The ScPCA Portal also supports other data modalities, such as bulk RNA-seq, CITE-seq, and spatial transcriptomics. The ScPCA Portal currently hosts data for over 500 pediatric tumor and patient-derived xenograft samples from more than 50 cancer types, and continues to grow. The Data Lab is seeking contributions to the ScPCA Portal from researchers with existing single-cell datasets.
We are excited to announce that our next workshop, Introduction to Single-cell RNA-Seq, will take place in-person from June 13-15, 2023! Data Lab staff will introduce researchers studying pediatric cancer to the R programming language, the Tidyverse R packages for data science, single-cell RNA-seq data analysis, annotating cell types, and more. The 3-day course will take place from 9am-5pm Eastern time in Bala Cynwyd, PA, just outside of Philadelphia. Travel reimbursement (up to a certain amount) is available for qualifying participants.
The Childhood Cancer Data Lab maintains a collection of uniformly processed single-cell data from pediatric cancer clinical samples and xenografts in the Single-cell Pediatric Cancer Atlas (ScPCA) Portal. Although access to preprocessed data saves researchers time, we know that the downloads from the ScPCA Portal are only the starting point. That’s why we’ve created downstream analysis workflows for commonly performed analyses. Instead of writing code wholesale, you can analyze data once you’ve configured these workflows.
We are excited to announce that our next virtual workshop, Introduction to Single-cell RNA-Seq, will run from May 15-19, 2023! In this workshop, Data Lab staff will introduce researchers studying pediatric cancer to the R programming language, the Tidyverse R packages for data science, single-cell RNA-seq data analysis, and annotating cell types.
Last year, the Data Lab launched the Single-cell Pediatric Cancer Atlas (ScPCA) Portal, which today holds uniformly processed single-cell gene expression data obtained from 8 separate labs, over 480 samples, and representing 38 cancer types. The portal is still growing as we continue to receive and process raw data from ScPCA investigators! All uniformly processed data is made available for download on the ScPCA Portal, giving researchers easy access to a growing database of summarized gene expression data and metadata to utilize for their own research. But how exactly did we make sure that all of the data was uniformly processed? And how are we able to ensure uniform processing for incoming samples as the portal continues to grow?
Are you attending the American Association for Cancer Research (AACR) annual meeting in Orlando, FL this year? Visit Alex's Lemonade Stand Foundation (ALSF) at booth 369 in the exhibit hall from April 16-19! You'll find information about ALSF's grants program, the Childhood Cancer Data Lab and more. The Data Lab will also be holding office hours during select time slots.
The Data Lab is excited to announce that our next training workshop will be held virtually from March 13-17, 2023! During this workshop, we will cover advanced topics in the analysis of single-cell RNA-seq data for researchers studying pediatric cancer. The workshop will take place each day from 12-5pm Eastern. Each day consists of lectures and designated time for attendees to work on exercise materials and their own projects with our staff available for consultation. You’ll need a laptop with internet access and to install Zoom and Slack. You will log into an RStudio Server hosted by the Data Lab from your web browser. Pediatric cancer researchers are encouraged to apply now!
In September 2022, the Open Pediatric Brain Tumor Atlas (OpenPBTA) project culminated (for now) in a preprint on bioRxiv. This project, started in late 2019 and co-organized with the Center for Data Driven Discovery in Biomedicine (D3b) at Children’s Hospital of Philadelphia (CHOP), is a collaborative effort to comprehensively describe the Pediatric Brain Tumor Atlas (PBTA), a collection of multiple data types from tens of tumor types (read more about why crowdsourcing expertise for the study of pediatric brain tumors is important here). The project is designed to allow for contributions from experts across multiple institutions. We’ve conducted analysis and drafting of the manuscript openly on the version-control platform GitHub from the project’s inception to facilitate those contributions.
Recently, we told you about the Single-cell Pediatric Cancer Atlas (ScPCA) downstream analysis workflow. This ready-to-go workflow is intended to be used with single-cell and single-nuclei gene expression data available on the ScPCA Portal. We developed this workflow to filter, normalize, and perform dimensionality reduction, as well as incorporate initial clustering results to each processed sample/library object. Now we’re excited to introduce one of our latest offerings for use with ScPCA data, a clustering analysis workflow, which can be applied to datasets after running the filtering, normalization, and dimensionality reduction workflow!
The Data Lab is excited to announce that our next training workshop will be held in-person from January 31-February 2, 2023! During this workshop, we will cover advanced topics in the analysis of single-cell RNA-seq data for researchers studying pediatric cancer. The 3-day course will take place from 9am-5pm Eastern time in Bala Cynwyd, PA, just outside of Philadelphia. Travel reimbursement is available for qualifying participants.
Welcome to the Data Lab’s December Scientific Community Bulletin! Each month we share upcoming opportunities from Alex’s Lemonade Stand Foundation (ALSF), the Data Lab, and other events that we have gathered from a variety of science and research organizations. Subscribe to our blog to be alerted about future Scientific Community Bulletin posts!
In this blog post, I’d like to give an overview of the refine.bio refactoring process and web accessibility considerations. Through this process, our goal is to enhance the site usability and performance by improving the code quality and making the application more accessible. But before going into more details about them, let me provide you a quick history of refine.bio.
Welcome to the Data Lab’s November Scientific Community Bulletin! Each month we share upcoming opportunities from Alex’s Lemonade Stand Foundation (ALSF), the Data Lab, and other events that we have gathered from a variety of science and research organizations. Subscribe to our blog to be alerted about future Scientific Community Bulletin posts!
Here at the Data Lab, we're all about, well, data! We believe that data sharing and accessibility is key to accelerating the research process, and ultimately to improving outcomes for childhood cancer patients. So, we were excited to learn that one of the goals of the NCI/NIH initiative, the Childhood Cancer Data Initiative (CCDI), is to build up a Data Ecosystem that will facilitate pediatric cancer researchers' ability to explore and collect data from disparate resources. Although this Ecosystem is still in the early stages, several components are already being developed and are available for researchers to use! One component that is particularly interesting to us is the CCDI's Childhood Cancer Data Catalog (CCDC).
Welcome to the October Scientific Community Bulletin! Each month we share upcoming opportunities from Alex’s Lemonade Stand Foundation (ALSF), the Data Lab, and other events that we have gathered from a variety of science and research organizations. Subscribe to our blog to be alerted about future Scientific Community Bulletin posts!
Welcome to the September Scientific Community Bulletin! Each month we share upcoming opportunities from Alex’s Lemonade Stand Foundation (ALSF), the Data Lab, and other events that we have gathered from a variety of science and research organizations. Subscribe to our blog to be alerted about future Scientific Community Bulletin posts!
At the Data Lab, we are constantly looking for ways to enhance the tools we build for pediatric cancer researchers. Earlier this year, we launched the Single-cell Pediatric Cancer Atlas portal, a database of uniformly-processed single-cell data from pediatric cancer clinical samples. One way we felt the portal could be even more beneficial to pediatric cancer researchers is with a ready-to-go workflow that takes in single-cell data and prepares it for downstream analyses such as unsupervised clustering.
The Data Lab is excited to announce our next virtual workshop running from September 19-23, 2022! In this workshop, Data Lab staff will introduce researchers studying pediatric cancer to the R programming language, the Tidyverse R packages for data science, single-cell RNA-seq data analysis, and pathway analysis.
The Data Lab teaches data science courses targeted toward pediatric cancer researchers that introduce topics such as analysis of gene expression in bulk and single-cell data and principles of reproducible research. I wrote previously about how we use RStudio Server for our remote courses to simplify setup, and I wanted to write a bit more about some of the instructional practices we use so that our participants get the best experience we can provide. In particular, I wanted to talk about our use of live coding to facilitate active learning, and one of the tools we developed to make our course development just a bit easier.
Welcome to the August Scientific Community Bulletin! Each month we share upcoming opportunities from Alex’s Lemonade Stand Foundation (ALSF), the Data Lab, and other events that we have gathered from a variety of science and research organizations.
Often when building a server-client web application, we will encounter a situation where we want to send requests to our API in the chronological order that they occur on the client. Due to the asynchronous nature of these requests, it might not be possible to send them in the same callback for the event that triggered them. This is because we want to use the response from the previous request to craft our current one. A solution to this problem would be to implement a queue. Instead of calling the API immediately after events occur, implementing a queue ensures the latest data is sent with any request.
Welcome to the July Scientific Community Bulletin! Each month we share upcoming opportunities from Alex’s Lemonade Stand Foundation (ALSF), the Data Lab, and other events that we have gathered from a variety of science and research organizations. Subscribe to our blog to be alerted about future Scientific Community Bulletin posts!
Welcome to the Childhood Cancer Data Lab’s new blog feature, the monthly Scientific Community Bulletin! At the start of each month, we will share upcoming opportunities from Alex’s Lemonade Stand Foundation (ALSF), the Data Lab, and other events that we have gathered from a variety of science and research organizations. Our goal is to promote learning opportunities and highlight some of the excellent resources that our community provides.
At the Data Lab, our science team has a practice where an individual team member shares something that they recently figured out (or didn’t totally figure out yet) on a biweekly basis. We call this short 5-10 minute presentation How I Solved This, and it’s a great way to formally share (often hard-won) knowledge with each other. In this post, we thought we’d share how we solved something with the `renv` package with you.
The Childhood Cancer Data Lab builds resources guided by the most pressing needs of our primary users: pediatric cancer researchers. As the Data Lab's UX Designer, I conduct research activities with scientists like usability evaluations, semi-structured interviews, and card sorts to gain insight into their activities, processes, pain-points, and behaviors. I work with scientists and engineers at the Data Lab to use this information to improve existing products and services or to create new ones.
The Data Lab is excited to announce that our next training workshop is taking place in-person on Friday, June 10, 2022! During this full day workshop, instructors will introduce principles and techniques to achieve reproducible results in computational cancer research. We’ll show you the fundamentals of commonly-used approaches in reproducibility that you can apply to increase the impact of your research by making your findings more robust and reliable!
The Childhood Cancer Data Lab is growing as a resource for pediatric cancer researchers and we have more to offer to our community now, than ever before. Transitioning to our new and improved website is an exciting milestone, and here, we look forward to sharing progress, introducing new initiatives, and cultivating more opportunities to support childhood cancer research. Welcome to our new virtual home!
The Single-cell Pediatric Cancer Atlas (ScPCA) project began in 2019 when Alex’s Lemonade Stand Foundation (ALSF) funded 10 awards for single-cell profiling of pediatric cancer samples. The goal was to produce an atlas of gene expression profiles for a variety of childhood cancer types from different organ sites.
The CCDL team includes science, engineering, and design expertise. Combining these three disciplines in different ways across projects enables us to carry out our mission.
Here at the CCDL we value putting publicly available data to work. For example, we are currently processing and normalizing 1.5 million publicly available gene expression samples totaling ~$1.5 billion research dollars expended.
Like many teams that work with large amounts of external software, we run into issues with our transitive dependencies. In general, transitive dependencies are a hard problem to solve.
Though technology can introduce great benefit into our lives, it is often accompanied by a substantial amount of time and some expected frustration before we can reap the rewards. The time spent learning a new technology is what we usually call a learning curve.
The workshop will last from 9AM to 5PM on October 14th, 15th, and 16th at the CCDL offices at 1429 Walnut St Philadelphia, PA, 19102.
The Childhood Cancer Data Lab powered by Alex's Lemonade Stand Foundation is hosting a workshop to introduce childhood cancer researchers to reproducible analysis of bulk and single-cell transcriptomic data.
The Childhood Cancer Data Lab (CCDL), an initiative of Alex's Lemonade Stand Foundation develops tools, trainings, and methods to empower childhood cancer researchers. The work at the CCDL is focused and impactful. There are multiple opportunities and challenges for you to apply and grow your skills as a scientist or as an engineer.
The Childhood Cancer Data Lab powered by Alex's Lemonade Stand Foundation is hosting a workshop to introduce childhood cancer researchers to reproducible analysis of bulk and single-cell transcriptomic data.
At this hands-on, 3-day session held in Houston, researchers learned data science skills that could accelerate their own work. Drawing on skills learned at the workshop, childhood cancer researchers can perform basic analyses of their work to make informed decisions on how to proceed with their own research. Don’t just take our word for it, though. Read more about the workshop’s incredibly valuable benefits through its attendees’ perspectives.
The goal of our refine.bio project is to download, process, and make available gene expression datasets that can be analyzed together, or in parts, depending on a researcher’s need. Childhood cancer researchers need to be able to use data generated through multiple profiling technologies including microarrays and RNA-sequencing.
There are countless log blog posts out there about the benefits of good logging, how to log well, and how much to log. Going through them all can be a real log blog slog. Wouldn't it be cool if you could log like this:logger.info("Something happened!", job=job.id, user=user.id) and get an easily searchable output.
Caffeine is a stimulant that can induce alertness in certain individuals when consumed at an appropriate quantity. Caffeine is often obtained by ingesting caffeine-containing solutions. However, no protocol for obtaining caffeine from dehydrated, roasted beans using materials typically available in a Philadelphia office has been described in the published literature.
Alex’s Lemonade Stand Foundation (ALSF) staunchly believes that stronger scientific sharing practices will accelerate the pace of discovery and finding cures for children with cancer. Robust sharing improves reproducibility, minimizes redundant studies and maximizes our return on research investment.
Earlier this year, Alex’s Lemonade Stand Foundation identified single-cell gene expression profiling as an opportunity to build an atlas of cell types within tumors that could be broadly reused by pediatric cancer researchers.
This year was a big one for the CCDL. In our mission to empower pediatric cancer experts poised for big discoveries with the knowledge, data and methods to reach them we launched a software product, developed and delivered training workshops on single-cell and bulk RNA-seq analysis, and hired our data science team among other milestones.
I’m a scientist at Sage Bionetworks, a nonprofit research organization in Seattle, WA. My work focuses on a family of rare pediatric diseases (NF): neurofibromatosis type 1, type 2, and schwannomatosis.
Our particular process is designed to source opportunities from our team members and external stakeholders, convert those opportunities into a set of potential goals, and then select the goals that we expect will most advance our mission.
The ability to restore scroll position is often critical for website usability. It helps users keep the flow of navigation when going back and forth between different pages. Most modern browsers take care of restoring the scroll position automatically, but it doesn’t always work for Single Page Applications where the content is generated on the client’s side, often asynchronously.
Carnegie Mellon University Libraries is partnering with the Childhood Cancer Data Lab (CCDL), founded by Alex’s Lemonade Stand Foundation, to host a Data Analysis workshop using CCDL materials.
The CCDL will have a team of scientists at the American Association for Cancer Research 2020 Annual Meeting in sunny San Diego! Our team members are excited to talk to researchers studying pediatric cancer at Booth 1601.
To help keep pediatric cancer research moving forward, here are 3 ways the CCDL is helping the research community during this time: refine.bio, virtual workshops, and the Open Pediatric Brain Tumor Atlas project.
We know that pandemic-related university closures mean that the demand for opportunities for pediatric cancer researchers to increase their analytical skills has never been higher. As such, we are delighted to announce a pilot virtual workshop running from May 4-8, 2020!
Here at the Childhood Cancer Data Lab, we value transparency and the practice of open science. Much of the work we’ve done and the products that we build hinge on the generosity and openness of other scientists. In this post, as part of National Brain Tumor Awareness month, we want to talk about a project that our science team has been working on over the last few months (and to do so in a way that aligns with our values).
The workshop will take place on June 22 - 26, 2020 from noon - 5pm Eastern. Each day consists of lectures and designated time for attendees to work on exercise materials and their own projects with CCDL staff available for consultation.
When the CCDL (along with everyone else) realized that we would have to conduct our bioinformatics training workshops remotely, we had to make some quick decisions about how we were going to do it. Most of the instructional materials for our in person workshops were already online, so we knew we had a good base to work from. We just needed to figure how to adapt the live instruction.
At Alex’s Lemonade Stand Foundation’s Childhood Cancer Data Lab, we’re excited to be helping out with an upcoming event hosted by the Children’s Tumor Foundation. If you participate, you may meet members of our team who are mentoring and judging.
The workshop will take place on March 22 - 26, 2021 from noon - 5pm Eastern. Each day consists of lectures and designated time for attendees to work on exercise materials and their own projects with CCDL staff available for consultation
The workshop will take place on June 28- July 2, 2021 from noon to 5pm eastern. Each day consists of lectures and designated time for attendees to work on exercise materials and their own projects with CCDL staff available for consultation.
Hack4Rare is a virtual event that calls for healthcare startups, developers, solutions architects, and hackathon enthusiasts to join researchers, clinicians and patients in developing solutions built around a number of rare diseases including neurofibromatosis, PTEN Hamartoma Tumor Syndrome, RASopathies and Desmoid Tumors.
The workshop will take place on September 20 - 24, 2021 from noon - 5pm Eastern. Each day consists of lectures and designated time for attendees to work on exercise materials and their own projects with CCDL staff available for consultation.
Introducing refine.bio examples. Here, users can access a variety of example analyses implemented in R, such as clustering and heat maps, differential expression analysis, and pathway analysis, for use with refine.bio data.

333 E. Lancaster Ave, #414
Wynnewood, PA 19096 USA
© Childhood Cancer Data Lab