Strategies to center user needs for research tools
What does a UX Designer do?
The Childhood Cancer Data Lab builds resources guided by the most pressing needs of our primary users: pediatric cancer researchers. As the Data Lab's UX Designer, I conduct research activities with scientists like usability evaluations, semi-structured interviews, and card sorts to gain insight into their activities, processes, pain-points, and behaviors. I work with scientists and engineers at the Data Lab to use this information to improve existing products and services or to create new ones. You can read more about how we collaborate here.
In this post, we will discuss the strategies we use to center user needs during the conceptualization and development phases of our tools and how these activities might benefit your organization too!
Usability and Research Tools
We design research tools that have similarities to enterprise tools, which are notoriously difficult to design, implement, and use. They are expected to be generic platforms that cover a large number of use cases and scenarios and serve a variety of roles and skill sets. The person making the buying decision is not the end user. This means that features that appeal to decision makers will be prioritized over enhancements to improve end user experience. Enterprise tools are often expensive, and once an organization is invested, it is difficult to pivot. As a result, end users are stuck with a tool which, at best, only somewhat meets their needs. At worst, users are forced to invent workarounds to get their job done.
Many parallels can be drawn between enterprise softwares and research tools. Research tools need to serve a wide user base with varying skill levels. Choices are limited and researchers are often forced to use a tool that either does not match their skill level or does not offer flexibility in its use. This results in what I like to call, “effort leakage”: researchers’ primary efforts are spent trying to make an ill-fitting tool work, rather than utilizing the tool to further their research goals.
When time is spent developing a research tool without considering who will use the tool, research becomes less efficient and is slowed down. The cost of ill-fit tools is too high in the context of research where the lives of children depend on good tools.
Whether we are designing tools or implementing processes, the Data Lab values efficiency. Just take a look at our tips for automating analyses and saving time in your research environment for further proof! Next, we'll tell you how we try to bake efficiency into our tools by ensuring that they are a good fit for our community.
A step back, a shift in mindset
It is helpful to think about a tool as solving two types of problems: a technical problem and a human problem. Let’s use one of the Data Lab’s tools to demonstrate this concept. During the development of refine.bio, we spent a lot of time defining the problems we wanted to solve. The technical problem entailed obtaining massive amounts of data from various sources, and uniformly processing and harmonizing it. The human problem entailed identifying the best way to deliver all of this processed data to researchers in a way that it is ready-to-use.
As a rule, we include scientific, engineering, and design perspectives from the conceptual stages of a project. We define the problem and then outline solutions as a team. Sure, it takes a little time to get started, but we begin with a robust strategy and avoid nasty surprises as we start to implement solutions.
Here are some key things that helped ensure success:
1. We ask ourselves a series of questions that we adapted from Stephen Gate’s podcast The Crazy One at the beginning of every project. This helps us gain a clear idea of the problem we are trying to solve and who we are trying to solve it for. Visit this blog for a glimpse at those questions.
Below are a few of the questions that have been modified to better fit our context:
- What are we trying to change and why?
- What are some things that have been done in the past?
We added two more questions to help us focus on the problem and avoid scope creep:
- What is this tool for?
- What is it NOT for?
We do this as an activity where each of us writes down our responses to the questions above. Then we take some time to walk everyone through our responses and provide our rationale. Finally, we discuss and combine it to a single document.
2. We speak to the community! We interview potential users of the tools we are developing. We talk to researchers who work in a variety of roles to learn from different perspectives.
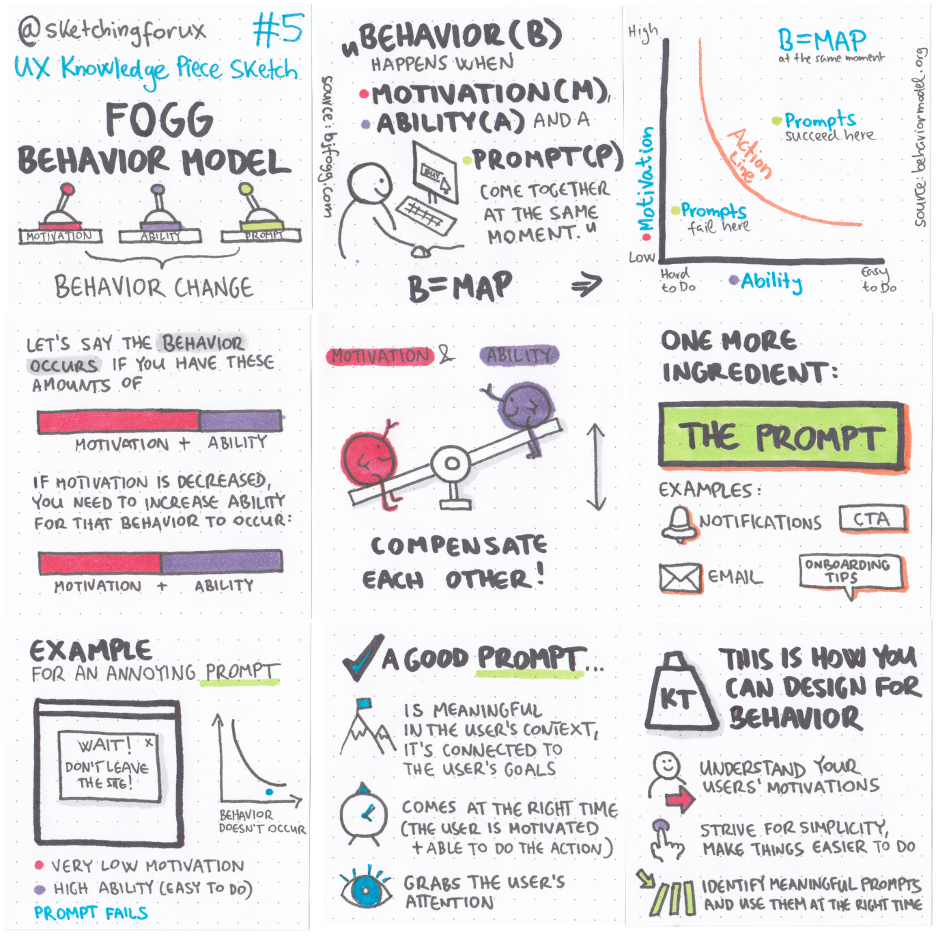
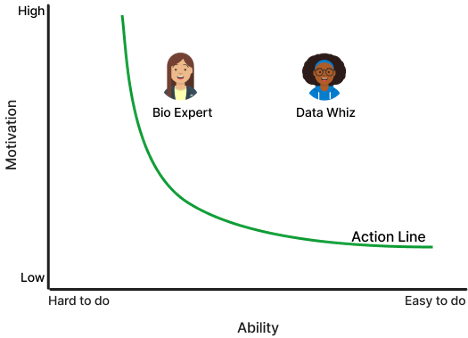
3. The Fogg Behavioral Model shows that “three elements must converge at the same moment for a behavior to occur: Motivation, Ability, and a Prompt. When a behavior does not occur, at least one of those three elements is missing.” We utilize this model to ensure that our tools are not too challenging to use.
User Personas
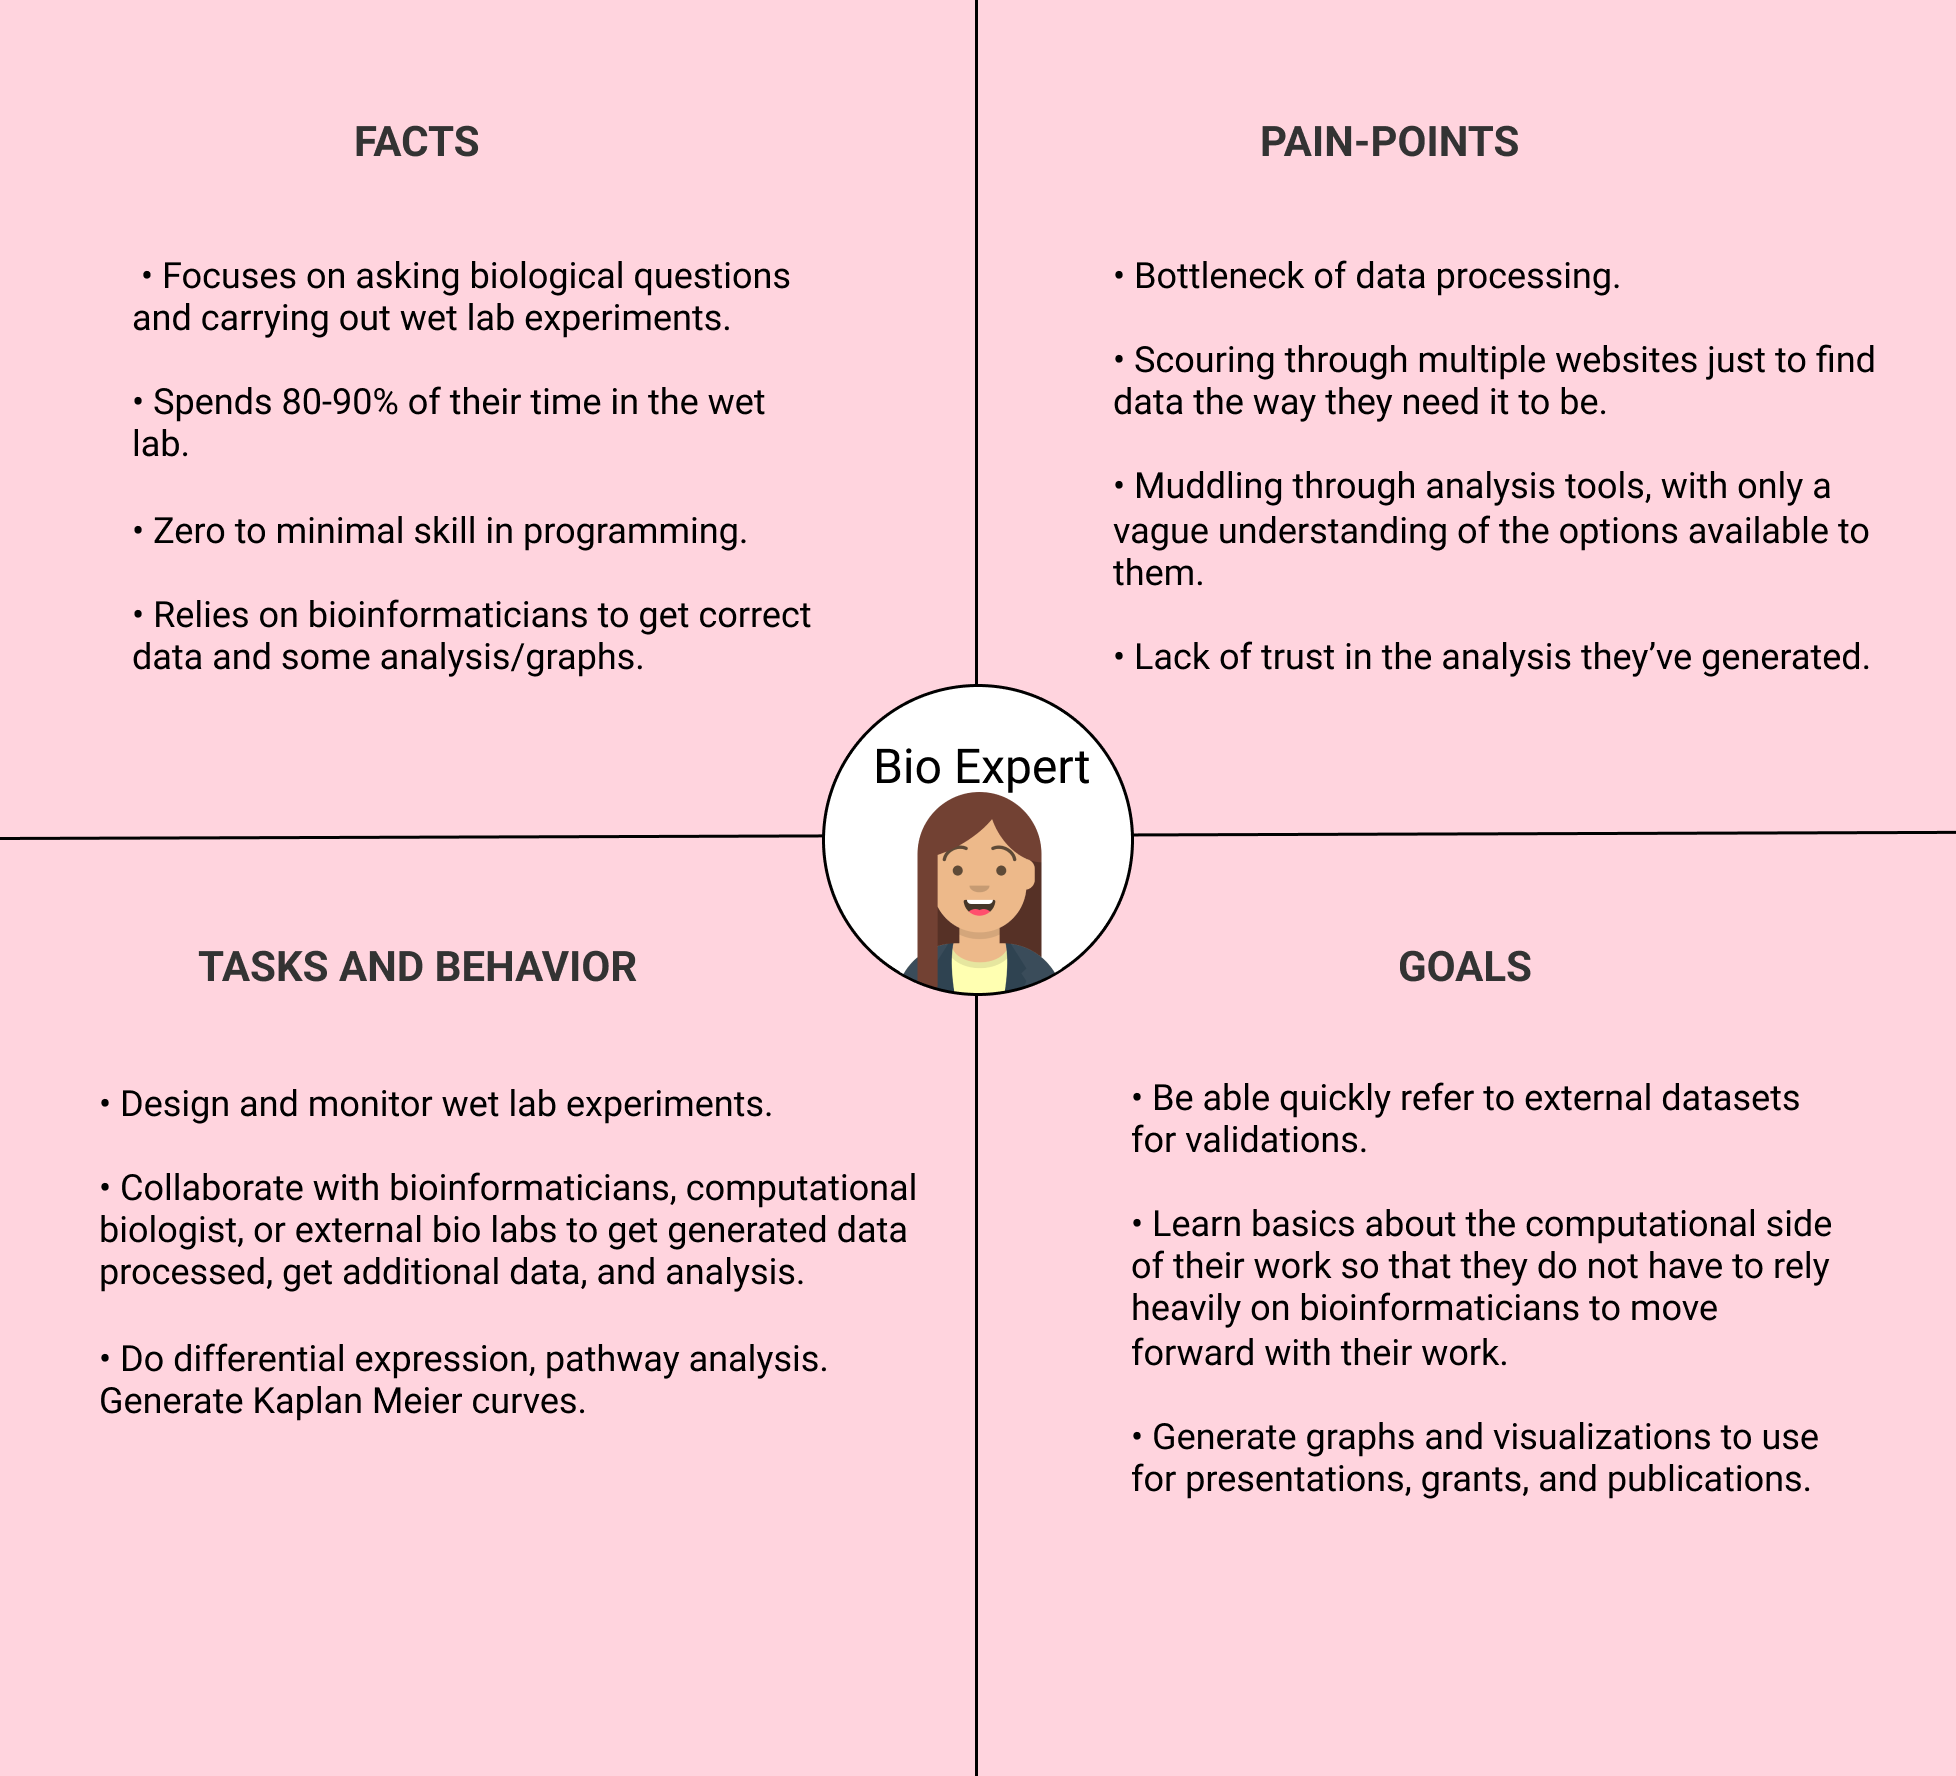
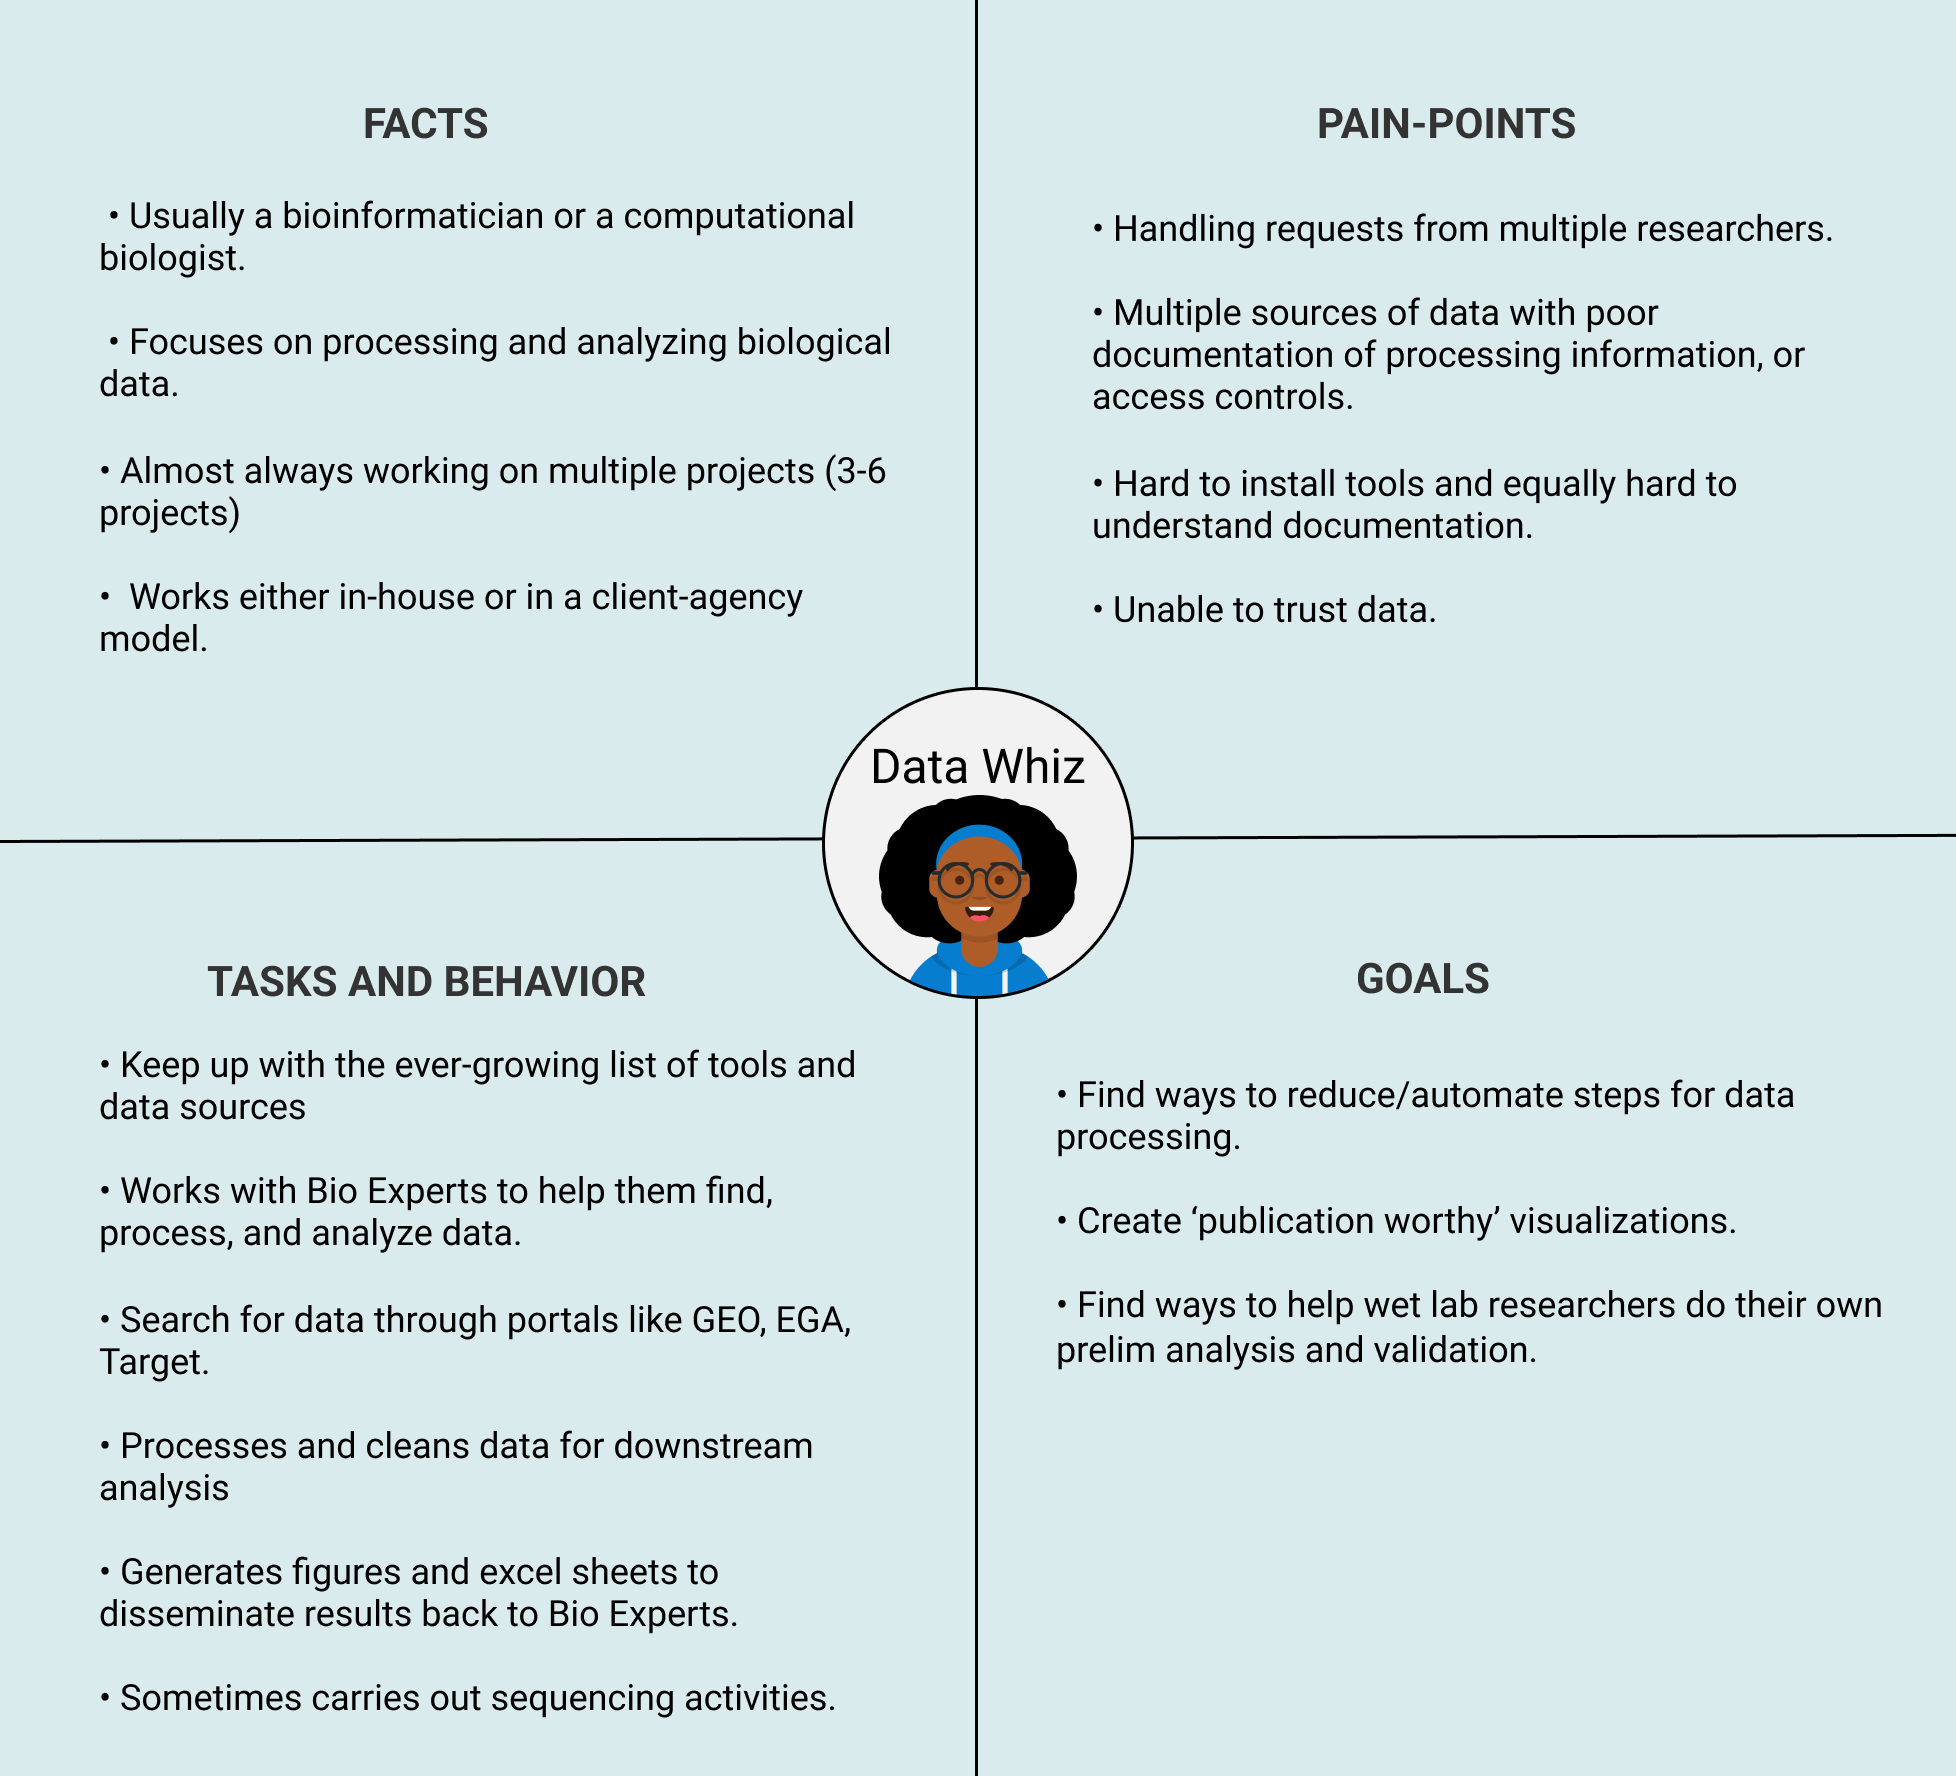
Based on the research we conducted for refine.bio, we defined two archetypes of users: Bio Experts and Data Whizzes. These are sometimes referred to as Personas. We used Lean Personas (also called proto-personas) to help us quickly identify the different needs of these different types of users. We have intentionally omitted demographics because our research indicated that it did not play a major role in our context.
Putting it all together
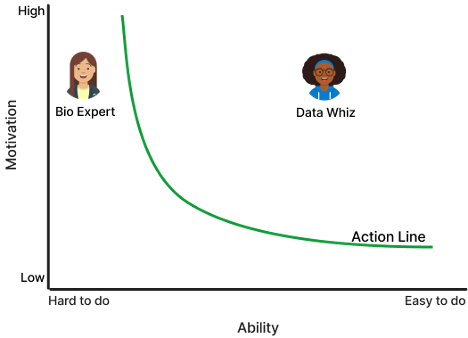
The ideal way refine.bio should behave for each of these user archetypes is different.
- For the Data Whizzes, providing an R or a Python client and documentation to get data would be sufficient for them to utilize the data downstream. Data Whizzes have the skills necessary to use standard data formats and conduct downstream analyses.
- For Bio Experts, their strength lies in biological domain knowledge. Even if they acquired that data via a web-based portal, they do not have sufficient technical skills to use it and get insights. Bio Experts need to expend a lot more effort to get value from refine.bio data than do Data Whizzes.
We introduced refine.bio examples as a way to help bridge the gap between acquiring data and getting initial results for Bio Experts. The examples are available as notebooks, which users can download and run locally, demonstrating the most common analyses like differential expression and pathway analysis. Users can easily swap out the example dataset with another refine.bio dataset.
At first, the examples were hosted on Github and required the user to either download or clone the repository before they could explore the example notebooks. We conducted a usability evaluation presenting Bio Experts with refine.bio examples and asked them to follow along with an analysis.
We uncovered several issues which made it difficult for Bio Experts to get started.
- Github was too challenging to navigate. It required learning an additional concept just to get started.
- There were many steps to take before Bio Experts could see the R notebook with the example and start to work on the core of their tasks.
- The instructions or commentary within the notebooks were not easy enough to follow.
We revamped refine.bio examples based on the results of the usability evaluations.
- We designed a website so that users no longer have to use Github to acquire the files. This also made it easier to locate different examples.
- We added sections to each of the R notebooks which walked users through setting up and also how to use it with a different refine.bio dataset.
- We rendered the notebooks in the browser so users can more easily explore them and discover what they offer.
- We introduced a more comprehensive Getting Started guide, along with links to R tutorials.
We conducted another round of usability evaluations to validate the changes. We learned that users found using refine.bio far less intimidating! They were able to download and follow along with the notebooks with less effort, and more importantly, less stress.
Little by little, one travels far
We have presented a neat and sanitized example, while the reality is that the problems tackled by the research community are complex and a single, all-encompassing solution is rarely the answer. It is easy to get overwhelmed and go down a rabbit hole of trying to do all things at once. It is important to remember creating tools is an iterative process. Everything doesn’t need to be solved now, and it doesn’t need to be perfect. It only needs to be usable.
Think of it as creating a multi-layered cake. Start with the base cake. Begin with the smallest problem with the highest impact that can be addressed. Then, add the next most important unit of work and so on. Finally you can address the problems that are nice-to-haves or, the icing on the cake.
This principle can also be applied to the strategies we’ve laid out above:
- Talk to at least 5 users. If you cannot speak with 5, talk to 1 user. If that isn’t possible, then talk to a coworker who isn’t involved with the project. Even a single conversation can provide useful perspectives and insights. Guerilla testing is a method to get some quick feedback from users.
- Do the activity with the teams you work with. If that isn’t possible, do it with your immediate team, and if that is also not possible, do it on your own.
- Apply the Fogg Model on smaller interactions, like structuring READMEs, writing docs, and even adding comments to code!
If you are in the business of creating tools for research and are interested in learning more about things like this, the good news is that our friends over in the tech and product world think about these concepts all the time.
Here are a couple of places to start:
Finally, if you can budget for it, hire software engineers, UX Researchers, and UX Designers, and more importantly, ensure that they are involved in the early stages of planning.
What does a UX Designer do?
The Childhood Cancer Data Lab builds resources guided by the most pressing needs of our primary users: pediatric cancer researchers. As the Data Lab's UX Designer, I conduct research activities with scientists like usability evaluations, semi-structured interviews, and card sorts to gain insight into their activities, processes, pain-points, and behaviors. I work with scientists and engineers at the Data Lab to use this information to improve existing products and services or to create new ones. You can read more about how we collaborate here.
In this post, we will discuss the strategies we use to center user needs during the conceptualization and development phases of our tools and how these activities might benefit your organization too!
Usability and Research Tools
We design research tools that have similarities to enterprise tools, which are notoriously difficult to design, implement, and use. They are expected to be generic platforms that cover a large number of use cases and scenarios and serve a variety of roles and skill sets. The person making the buying decision is not the end user. This means that features that appeal to decision makers will be prioritized over enhancements to improve end user experience. Enterprise tools are often expensive, and once an organization is invested, it is difficult to pivot. As a result, end users are stuck with a tool which, at best, only somewhat meets their needs. At worst, users are forced to invent workarounds to get their job done.
Many parallels can be drawn between enterprise softwares and research tools. Research tools need to serve a wide user base with varying skill levels. Choices are limited and researchers are often forced to use a tool that either does not match their skill level or does not offer flexibility in its use. This results in what I like to call, “effort leakage”: researchers’ primary efforts are spent trying to make an ill-fitting tool work, rather than utilizing the tool to further their research goals.
When time is spent developing a research tool without considering who will use the tool, research becomes less efficient and is slowed down. The cost of ill-fit tools is too high in the context of research where the lives of children depend on good tools.
Whether we are designing tools or implementing processes, the Data Lab values efficiency. Just take a look at our tips for automating analyses and saving time in your research environment for further proof! Next, we'll tell you how we try to bake efficiency into our tools by ensuring that they are a good fit for our community.
A step back, a shift in mindset
It is helpful to think about a tool as solving two types of problems: a technical problem and a human problem. Let’s use one of the Data Lab’s tools to demonstrate this concept. During the development of refine.bio, we spent a lot of time defining the problems we wanted to solve. The technical problem entailed obtaining massive amounts of data from various sources, and uniformly processing and harmonizing it. The human problem entailed identifying the best way to deliver all of this processed data to researchers in a way that it is ready-to-use.
As a rule, we include scientific, engineering, and design perspectives from the conceptual stages of a project. We define the problem and then outline solutions as a team. Sure, it takes a little time to get started, but we begin with a robust strategy and avoid nasty surprises as we start to implement solutions.
Here are some key things that helped ensure success:
1. We ask ourselves a series of questions that we adapted from Stephen Gate’s podcast The Crazy One at the beginning of every project. This helps us gain a clear idea of the problem we are trying to solve and who we are trying to solve it for. Visit this blog for a glimpse at those questions.
Below are a few of the questions that have been modified to better fit our context:
- What are we trying to change and why?
- What are some things that have been done in the past?
We added two more questions to help us focus on the problem and avoid scope creep:
- What is this tool for?
- What is it NOT for?
We do this as an activity where each of us writes down our responses to the questions above. Then we take some time to walk everyone through our responses and provide our rationale. Finally, we discuss and combine it to a single document.
2. We speak to the community! We interview potential users of the tools we are developing. We talk to researchers who work in a variety of roles to learn from different perspectives.
3. The Fogg Behavioral Model shows that “three elements must converge at the same moment for a behavior to occur: Motivation, Ability, and a Prompt. When a behavior does not occur, at least one of those three elements is missing.” We utilize this model to ensure that our tools are not too challenging to use.
User Personas
Based on the research we conducted for refine.bio, we defined two archetypes of users: Bio Experts and Data Whizzes. These are sometimes referred to as Personas. We used Lean Personas (also called proto-personas) to help us quickly identify the different needs of these different types of users. We have intentionally omitted demographics because our research indicated that it did not play a major role in our context.
Putting it all together
The ideal way refine.bio should behave for each of these user archetypes is different.
- For the Data Whizzes, providing an R or a Python client and documentation to get data would be sufficient for them to utilize the data downstream. Data Whizzes have the skills necessary to use standard data formats and conduct downstream analyses.
- For Bio Experts, their strength lies in biological domain knowledge. Even if they acquired that data via a web-based portal, they do not have sufficient technical skills to use it and get insights. Bio Experts need to expend a lot more effort to get value from refine.bio data than do Data Whizzes.
We introduced refine.bio examples as a way to help bridge the gap between acquiring data and getting initial results for Bio Experts. The examples are available as notebooks, which users can download and run locally, demonstrating the most common analyses like differential expression and pathway analysis. Users can easily swap out the example dataset with another refine.bio dataset.
At first, the examples were hosted on Github and required the user to either download or clone the repository before they could explore the example notebooks. We conducted a usability evaluation presenting Bio Experts with refine.bio examples and asked them to follow along with an analysis.
We uncovered several issues which made it difficult for Bio Experts to get started.
- Github was too challenging to navigate. It required learning an additional concept just to get started.
- There were many steps to take before Bio Experts could see the R notebook with the example and start to work on the core of their tasks.
- The instructions or commentary within the notebooks were not easy enough to follow.
We revamped refine.bio examples based on the results of the usability evaluations.
- We designed a website so that users no longer have to use Github to acquire the files. This also made it easier to locate different examples.
- We added sections to each of the R notebooks which walked users through setting up and also how to use it with a different refine.bio dataset.
- We rendered the notebooks in the browser so users can more easily explore them and discover what they offer.
- We introduced a more comprehensive Getting Started guide, along with links to R tutorials.
We conducted another round of usability evaluations to validate the changes. We learned that users found using refine.bio far less intimidating! They were able to download and follow along with the notebooks with less effort, and more importantly, less stress.
Little by little, one travels far
We have presented a neat and sanitized example, while the reality is that the problems tackled by the research community are complex and a single, all-encompassing solution is rarely the answer. It is easy to get overwhelmed and go down a rabbit hole of trying to do all things at once. It is important to remember creating tools is an iterative process. Everything doesn’t need to be solved now, and it doesn’t need to be perfect. It only needs to be usable.
Think of it as creating a multi-layered cake. Start with the base cake. Begin with the smallest problem with the highest impact that can be addressed. Then, add the next most important unit of work and so on. Finally you can address the problems that are nice-to-haves or, the icing on the cake.
This principle can also be applied to the strategies we’ve laid out above:
- Talk to at least 5 users. If you cannot speak with 5, talk to 1 user. If that isn’t possible, then talk to a coworker who isn’t involved with the project. Even a single conversation can provide useful perspectives and insights. Guerilla testing is a method to get some quick feedback from users.
- Do the activity with the teams you work with. If that isn’t possible, do it with your immediate team, and if that is also not possible, do it on your own.
- Apply the Fogg Model on smaller interactions, like structuring READMEs, writing docs, and even adding comments to code!
If you are in the business of creating tools for research and are interested in learning more about things like this, the good news is that our friends over in the tech and product world think about these concepts all the time.
Here are a couple of places to start:
Finally, if you can budget for it, hire software engineers, UX Researchers, and UX Designers, and more importantly, ensure that they are involved in the early stages of planning.
Related Post
In March 2022, we launched the Single-cell Pediatric Cancer Atlas (ScPCA) Portal to make uniformly processed single-cell and single-nuclei RNA-Seq data widely available to the childhood cancer research community. Initially, all data available on the Portal was generated through grants funded by Alex’s Lemonade Stand Foundation (ALSF) as part of the ScPCA project. But enabling access to ALSF-funded data was just the beginning of our vision.Sharing is key to ensuring the Portal’s continued growth. Our sights were set on allowing more pediatric cancer researchers to contribute data to the ScPCA Portal.
The Data Lab has just launched the brand new Open Single-cell Pediatric Cancer Atlas (OpenScPCA) project! This open, collaborative project aims to analyze data from the ScPCA Portal, which currently holds 500 samples from over 50 pediatric cancer types. We are seeking contributors with diverse skills and expertise to join the project!
We are excited to announce that our next virtual workshop, Introduction to Single-cell RNA-Seq, will run from June 10-14, 2024! In this workshop, Data Lab staff will introduce researchers studying pediatric cancer to the R programming language, the Tidyverse R packages for data science, single-cell RNA-seq data analysis, and annotating cell types.
Applications are open for the Data Lab's next workshop! We are holding a two-day course on Reproducible Research Practices and the Open Single-cell Pediatric Cancer Atlas (OpenScPCA) project from May 14-15, 2024. Please note that the OpenScPCA module is an optional part of the workshop. The course begins with an introduction to principles and techniques to achieve reproducible results in computational cancer research. On day two, you can choose to continue the workshop and learn how to put your skills to use for OpenScPCA, our new pediatric cancer research project.
Are you attending the American Association for Cancer Research (AACR) annual meeting in San Diego, CA? Visit the Alex’s Lemonade Stand Foundation (ALSF) Grants and Data Lab teams at booth 3755 in the exhibit hall from April 7-10 and during poster sessions on April 8. We will announce a new collaborative project and share exciting news about the Single-cell Pediatric Cancer Atlas Portal and training opportunities!
Did you know that 70% of the Alex’s Lemonade Stand Foundation (ALSF) Childhood Cancer Data Lab team are currently women? Advancing our mission to empower childhood cancer researchers with knowledge, data, and tools would not be possible without their expertise. On the International Day of Women and Girls in Science, we are excited to introduce you to these women who integrate science, engineering, and design to tackle some of the greatest challenges faced by the pediatric cancer research community!
I have a confession to make: I am lazy. Ok, maybe that's too strong. Let's go for a euphemism instead: I am efficient. I love learning handy tricks that make my life easier and make my job smoother with fewer hiccups along the way. This is one part of why, here in the Data Lab, we love automation - why waste our time on rote, repetitive, housekeeping tasks when we can get the bots to do it for us? In this blog post, we'll highlight a few tips about how you can use RStudio to code more efficiently.
Writing source code is a significant part of data-intensive biomedical research. Everything from cleaning and pre-processing data to generating publication figures can be accomplished programmatically. Increasingly, funding agencies and journals require researchers to share their code. To pick a few examples, the Data Lab’s parent organization, Alex’s Lemonade Stand Foundation (ALSF), has such a requirement for awardees, and PLoS Computational Biology requires authors to make code underlying results and conclusions available.
There is an old joke in computer science about how there are only two hard things: cache invalidation, naming things, and off-by-one errors. I’ll leave aside the first one as beyond my own expertise, but the second comes up all the time in my work as a biological data scientist. Naming variables and functions in my code is a constant struggle, but one I have to deal with on my own or with my team. Much bigger problems come up when trying to deal with all the various ways that people across the world use names when talking about the diseases they work on, the types of cells they are looking at, the experimental methods they are using, and just about every other aspect of their studies.
Applications are open for the Data Lab's next workshop! We will be holding a Reproducible Research Practices Course in-person on October 24-25, 2023. Instructors will introduce principles and techniques to achieve reproducible results in computational cancer research. We’ll show you the fundamentals of commonly-used approaches in reproducibility that you can apply to increase the impact of your research by making your findings more robust and reliable! To ensure that workshop attendees have a great hands-on experience, there will be a very limited number of seats available.
At the Center for Data-Driven Discovery in Biomedicine (D3b), I lead the Bioinformatics Translational Pediatric Oncology Team, a team of bioinformatics scientists. Our mission is to advance pediatric oncology research and precision medicine through collaboration and development of open-source analytical tools, frameworks, and data resources. In 1998, I lost my four year old cousin John Matthew to a brain tumor we now know was likely a diffuse intrinsic pontine glioma. So, it was bittersweet for me to see the Open Pediatric Brain Tumor Atlas (OpenPBTA) manuscript published in Cell Genomics on the last day of brain tumor awareness month this past year. But let’s rewind.
Writing effective documentation is challenging. Users might not always read every word in the documentation. They might even just scroll past large chunks of text, but we can accommodate those behaviors by structuring and formatting content appropriately.
In 2019, Alex’s Lemonade Stand Foundation (ALSF) established the Single-cell Pediatric Cancer Atlas (ScPCA) through awards for data generation and to create an atlas of single-cell gene expression profiles of pediatric cancers of different types and from different organ sites. The Data Lab launched the ScPCA Portal in 2022 to make uniformly processed, summarized single-cell and single-nuclei RNA-seq data and de-identified metadata available for download. The ScPCA Portal also supports other data modalities, such as bulk RNA-seq, CITE-seq, and spatial transcriptomics. The ScPCA Portal currently hosts data for over 500 pediatric tumor and patient-derived xenograft samples from more than 50 cancer types, and continues to grow. The Data Lab is seeking contributions to the ScPCA Portal from researchers with existing single-cell datasets.
We are excited to announce that our next workshop, Introduction to Single-cell RNA-Seq, will take place in-person from June 13-15, 2023! Data Lab staff will introduce researchers studying pediatric cancer to the R programming language, the Tidyverse R packages for data science, single-cell RNA-seq data analysis, annotating cell types, and more. The 3-day course will take place from 9am-5pm Eastern time in Bala Cynwyd, PA, just outside of Philadelphia. Travel reimbursement (up to a certain amount) is available for qualifying participants.
The Childhood Cancer Data Lab maintains a collection of uniformly processed single-cell data from pediatric cancer clinical samples and xenografts in the Single-cell Pediatric Cancer Atlas (ScPCA) Portal. Although access to preprocessed data saves researchers time, we know that the downloads from the ScPCA Portal are only the starting point. That’s why we’ve created downstream analysis workflows for commonly performed analyses. Instead of writing code wholesale, you can analyze data once you’ve configured these workflows.
We are excited to announce that our next virtual workshop, Introduction to Single-cell RNA-Seq, will run from May 15-19, 2023! In this workshop, Data Lab staff will introduce researchers studying pediatric cancer to the R programming language, the Tidyverse R packages for data science, single-cell RNA-seq data analysis, and annotating cell types.
Last year, the Data Lab launched the Single-cell Pediatric Cancer Atlas (ScPCA) Portal, which today holds uniformly processed single-cell gene expression data obtained from 8 separate labs, over 480 samples, and representing 38 cancer types. The portal is still growing as we continue to receive and process raw data from ScPCA investigators! All uniformly processed data is made available for download on the ScPCA Portal, giving researchers easy access to a growing database of summarized gene expression data and metadata to utilize for their own research. But how exactly did we make sure that all of the data was uniformly processed? And how are we able to ensure uniform processing for incoming samples as the portal continues to grow?
Are you attending the American Association for Cancer Research (AACR) annual meeting in Orlando, FL this year? Visit Alex's Lemonade Stand Foundation (ALSF) at booth 369 in the exhibit hall from April 16-19! You'll find information about ALSF's grants program, the Childhood Cancer Data Lab and more. The Data Lab will also be holding office hours during select time slots.
The Data Lab is excited to announce that our next training workshop will be held virtually from March 13-17, 2023! During this workshop, we will cover advanced topics in the analysis of single-cell RNA-seq data for researchers studying pediatric cancer. The workshop will take place each day from 12-5pm Eastern. Each day consists of lectures and designated time for attendees to work on exercise materials and their own projects with our staff available for consultation. You’ll need a laptop with internet access and to install Zoom and Slack. You will log into an RStudio Server hosted by the Data Lab from your web browser. Pediatric cancer researchers are encouraged to apply now!
In September 2022, the Open Pediatric Brain Tumor Atlas (OpenPBTA) project culminated (for now) in a preprint on bioRxiv. This project, started in late 2019 and co-organized with the Center for Data Driven Discovery in Biomedicine (D3b) at Children’s Hospital of Philadelphia (CHOP), is a collaborative effort to comprehensively describe the Pediatric Brain Tumor Atlas (PBTA), a collection of multiple data types from tens of tumor types (read more about why crowdsourcing expertise for the study of pediatric brain tumors is important here). The project is designed to allow for contributions from experts across multiple institutions. We’ve conducted analysis and drafting of the manuscript openly on the version-control platform GitHub from the project’s inception to facilitate those contributions.
Recently, we told you about the Single-cell Pediatric Cancer Atlas (ScPCA) downstream analysis workflow. This ready-to-go workflow is intended to be used with single-cell and single-nuclei gene expression data available on the ScPCA Portal. We developed this workflow to filter, normalize, and perform dimensionality reduction, as well as incorporate initial clustering results to each processed sample/library object. Now we’re excited to introduce one of our latest offerings for use with ScPCA data, a clustering analysis workflow, which can be applied to datasets after running the filtering, normalization, and dimensionality reduction workflow!
The Data Lab is excited to announce that our next training workshop will be held in-person from January 31-February 2, 2023! During this workshop, we will cover advanced topics in the analysis of single-cell RNA-seq data for researchers studying pediatric cancer. The 3-day course will take place from 9am-5pm Eastern time in Bala Cynwyd, PA, just outside of Philadelphia. Travel reimbursement is available for qualifying participants.
Welcome to the Data Lab’s December Scientific Community Bulletin! Each month we share upcoming opportunities from Alex’s Lemonade Stand Foundation (ALSF), the Data Lab, and other events that we have gathered from a variety of science and research organizations. Subscribe to our blog to be alerted about future Scientific Community Bulletin posts!
In this blog post, I’d like to give an overview of the refine.bio refactoring process and web accessibility considerations. Through this process, our goal is to enhance the site usability and performance by improving the code quality and making the application more accessible. But before going into more details about them, let me provide you a quick history of refine.bio.
Welcome to the Data Lab’s November Scientific Community Bulletin! Each month we share upcoming opportunities from Alex’s Lemonade Stand Foundation (ALSF), the Data Lab, and other events that we have gathered from a variety of science and research organizations. Subscribe to our blog to be alerted about future Scientific Community Bulletin posts!
Here at the Data Lab, we're all about, well, data! We believe that data sharing and accessibility is key to accelerating the research process, and ultimately to improving outcomes for childhood cancer patients. So, we were excited to learn that one of the goals of the NCI/NIH initiative, the Childhood Cancer Data Initiative (CCDI), is to build up a Data Ecosystem that will facilitate pediatric cancer researchers' ability to explore and collect data from disparate resources. Although this Ecosystem is still in the early stages, several components are already being developed and are available for researchers to use! One component that is particularly interesting to us is the CCDI's Childhood Cancer Data Catalog (CCDC).
Welcome to the October Scientific Community Bulletin! Each month we share upcoming opportunities from Alex’s Lemonade Stand Foundation (ALSF), the Data Lab, and other events that we have gathered from a variety of science and research organizations. Subscribe to our blog to be alerted about future Scientific Community Bulletin posts!
Welcome to the September Scientific Community Bulletin! Each month we share upcoming opportunities from Alex’s Lemonade Stand Foundation (ALSF), the Data Lab, and other events that we have gathered from a variety of science and research organizations. Subscribe to our blog to be alerted about future Scientific Community Bulletin posts!
At the Data Lab, we are constantly looking for ways to enhance the tools we build for pediatric cancer researchers. Earlier this year, we launched the Single-cell Pediatric Cancer Atlas portal, a database of uniformly-processed single-cell data from pediatric cancer clinical samples. One way we felt the portal could be even more beneficial to pediatric cancer researchers is with a ready-to-go workflow that takes in single-cell data and prepares it for downstream analyses such as unsupervised clustering.
The Data Lab is excited to announce our next virtual workshop running from September 19-23, 2022! In this workshop, Data Lab staff will introduce researchers studying pediatric cancer to the R programming language, the Tidyverse R packages for data science, single-cell RNA-seq data analysis, and pathway analysis.
The Data Lab teaches data science courses targeted toward pediatric cancer researchers that introduce topics such as analysis of gene expression in bulk and single-cell data and principles of reproducible research. I wrote previously about how we use RStudio Server for our remote courses to simplify setup, and I wanted to write a bit more about some of the instructional practices we use so that our participants get the best experience we can provide. In particular, I wanted to talk about our use of live coding to facilitate active learning, and one of the tools we developed to make our course development just a bit easier.
Welcome to the August Scientific Community Bulletin! Each month we share upcoming opportunities from Alex’s Lemonade Stand Foundation (ALSF), the Data Lab, and other events that we have gathered from a variety of science and research organizations.
Often when building a server-client web application, we will encounter a situation where we want to send requests to our API in the chronological order that they occur on the client. Due to the asynchronous nature of these requests, it might not be possible to send them in the same callback for the event that triggered them. This is because we want to use the response from the previous request to craft our current one. A solution to this problem would be to implement a queue. Instead of calling the API immediately after events occur, implementing a queue ensures the latest data is sent with any request.
Welcome to the July Scientific Community Bulletin! Each month we share upcoming opportunities from Alex’s Lemonade Stand Foundation (ALSF), the Data Lab, and other events that we have gathered from a variety of science and research organizations. Subscribe to our blog to be alerted about future Scientific Community Bulletin posts!
Welcome to the Childhood Cancer Data Lab’s new blog feature, the monthly Scientific Community Bulletin! At the start of each month, we will share upcoming opportunities from Alex’s Lemonade Stand Foundation (ALSF), the Data Lab, and other events that we have gathered from a variety of science and research organizations. Our goal is to promote learning opportunities and highlight some of the excellent resources that our community provides.
At the Data Lab, our science team has a practice where an individual team member shares something that they recently figured out (or didn’t totally figure out yet) on a biweekly basis. We call this short 5-10 minute presentation How I Solved This, and it’s a great way to formally share (often hard-won) knowledge with each other. In this post, we thought we’d share how we solved something with the `renv` package with you.
The Data Lab is excited to announce that our next training workshop is taking place in-person on Friday, June 10, 2022! During this full day workshop, instructors will introduce principles and techniques to achieve reproducible results in computational cancer research. We’ll show you the fundamentals of commonly-used approaches in reproducibility that you can apply to increase the impact of your research by making your findings more robust and reliable!
The Childhood Cancer Data Lab is growing as a resource for pediatric cancer researchers and we have more to offer to our community now, than ever before. Transitioning to our new and improved website is an exciting milestone, and here, we look forward to sharing progress, introducing new initiatives, and cultivating more opportunities to support childhood cancer research. Welcome to our new virtual home!
The Single-cell Pediatric Cancer Atlas (ScPCA) project began in 2019 when Alex’s Lemonade Stand Foundation (ALSF) funded 10 awards for single-cell profiling of pediatric cancer samples. The goal was to produce an atlas of gene expression profiles for a variety of childhood cancer types from different organ sites.
The CCDL team includes science, engineering, and design expertise. Combining these three disciplines in different ways across projects enables us to carry out our mission.
Here at the CCDL we value putting publicly available data to work. For example, we are currently processing and normalizing 1.5 million publicly available gene expression samples totaling ~$1.5 billion research dollars expended.
Like many teams that work with large amounts of external software, we run into issues with our transitive dependencies. In general, transitive dependencies are a hard problem to solve.
Though technology can introduce great benefit into our lives, it is often accompanied by a substantial amount of time and some expected frustration before we can reap the rewards. The time spent learning a new technology is what we usually call a learning curve.
The workshop will last from 9AM to 5PM on October 14th, 15th, and 16th at the CCDL offices at 1429 Walnut St Philadelphia, PA, 19102.
MultiPLIER is a machine learning approach that brings big data to bear on rare diseases. It’s also an example of the scientific approach and ethos of the CCDL, and the publication is a great opportunity to share how the CCDL is developing new technologies to accelerate research into cures for childhood cancers!
The Childhood Cancer Data Lab powered by Alex's Lemonade Stand Foundation is hosting a workshop to introduce childhood cancer researchers to reproducible analysis of bulk and single-cell transcriptomic data.
The Childhood Cancer Data Lab (CCDL), an initiative of Alex's Lemonade Stand Foundation develops tools, trainings, and methods to empower childhood cancer researchers. The work at the CCDL is focused and impactful. There are multiple opportunities and challenges for you to apply and grow your skills as a scientist or as an engineer.
The Childhood Cancer Data Lab powered by Alex's Lemonade Stand Foundation is hosting a workshop to introduce childhood cancer researchers to reproducible analysis of bulk and single-cell transcriptomic data.
At this hands-on, 3-day session held in Houston, researchers learned data science skills that could accelerate their own work. Drawing on skills learned at the workshop, childhood cancer researchers can perform basic analyses of their work to make informed decisions on how to proceed with their own research. Don’t just take our word for it, though. Read more about the workshop’s incredibly valuable benefits through its attendees’ perspectives.
The goal of our refine.bio project is to download, process, and make available gene expression datasets that can be analyzed together, or in parts, depending on a researcher’s need. Childhood cancer researchers need to be able to use data generated through multiple profiling technologies including microarrays and RNA-sequencing.
There are countless log blog posts out there about the benefits of good logging, how to log well, and how much to log. Going through them all can be a real log blog slog. Wouldn't it be cool if you could log like this:logger.info("Something happened!", job=job.id, user=user.id) and get an easily searchable output.
Caffeine is a stimulant that can induce alertness in certain individuals when consumed at an appropriate quantity. Caffeine is often obtained by ingesting caffeine-containing solutions. However, no protocol for obtaining caffeine from dehydrated, roasted beans using materials typically available in a Philadelphia office has been described in the published literature.
Alex’s Lemonade Stand Foundation (ALSF) staunchly believes that stronger scientific sharing practices will accelerate the pace of discovery and finding cures for children with cancer. Robust sharing improves reproducibility, minimizes redundant studies and maximizes our return on research investment.
Earlier this year, Alex’s Lemonade Stand Foundation identified single-cell gene expression profiling as an opportunity to build an atlas of cell types within tumors that could be broadly reused by pediatric cancer researchers.
This year was a big one for the CCDL. In our mission to empower pediatric cancer experts poised for big discoveries with the knowledge, data and methods to reach them we launched a software product, developed and delivered training workshops on single-cell and bulk RNA-seq analysis, and hired our data science team among other milestones.
I’m a scientist at Sage Bionetworks, a nonprofit research organization in Seattle, WA. My work focuses on a family of rare pediatric diseases (NF): neurofibromatosis type 1, type 2, and schwannomatosis.
Our particular process is designed to source opportunities from our team members and external stakeholders, convert those opportunities into a set of potential goals, and then select the goals that we expect will most advance our mission.
The ability to restore scroll position is often critical for website usability. It helps users keep the flow of navigation when going back and forth between different pages. Most modern browsers take care of restoring the scroll position automatically, but it doesn’t always work for Single Page Applications where the content is generated on the client’s side, often asynchronously.
Carnegie Mellon University Libraries is partnering with the Childhood Cancer Data Lab (CCDL), founded by Alex’s Lemonade Stand Foundation, to host a Data Analysis workshop using CCDL materials.
The CCDL will have a team of scientists at the American Association for Cancer Research 2020 Annual Meeting in sunny San Diego! Our team members are excited to talk to researchers studying pediatric cancer at Booth 1601.
To help keep pediatric cancer research moving forward, here are 3 ways the CCDL is helping the research community during this time: refine.bio, virtual workshops, and the Open Pediatric Brain Tumor Atlas project.
We know that pandemic-related university closures mean that the demand for opportunities for pediatric cancer researchers to increase their analytical skills has never been higher. As such, we are delighted to announce a pilot virtual workshop running from May 4-8, 2020!
Here at the Childhood Cancer Data Lab, we value transparency and the practice of open science. Much of the work we’ve done and the products that we build hinge on the generosity and openness of other scientists. In this post, as part of National Brain Tumor Awareness month, we want to talk about a project that our science team has been working on over the last few months (and to do so in a way that aligns with our values).
The workshop will take place on June 22 - 26, 2020 from noon - 5pm Eastern. Each day consists of lectures and designated time for attendees to work on exercise materials and their own projects with CCDL staff available for consultation.
When the CCDL (along with everyone else) realized that we would have to conduct our bioinformatics training workshops remotely, we had to make some quick decisions about how we were going to do it. Most of the instructional materials for our in person workshops were already online, so we knew we had a good base to work from. We just needed to figure how to adapt the live instruction.
At Alex’s Lemonade Stand Foundation’s Childhood Cancer Data Lab, we’re excited to be helping out with an upcoming event hosted by the Children’s Tumor Foundation. If you participate, you may meet members of our team who are mentoring and judging.
The workshop will take place on March 22 - 26, 2021 from noon - 5pm Eastern. Each day consists of lectures and designated time for attendees to work on exercise materials and their own projects with CCDL staff available for consultation
The workshop will take place on June 28- July 2, 2021 from noon to 5pm eastern. Each day consists of lectures and designated time for attendees to work on exercise materials and their own projects with CCDL staff available for consultation.
Hack4Rare is a virtual event that calls for healthcare startups, developers, solutions architects, and hackathon enthusiasts to join researchers, clinicians and patients in developing solutions built around a number of rare diseases including neurofibromatosis, PTEN Hamartoma Tumor Syndrome, RASopathies and Desmoid Tumors.
The workshop will take place on September 20 - 24, 2021 from noon - 5pm Eastern. Each day consists of lectures and designated time for attendees to work on exercise materials and their own projects with CCDL staff available for consultation.
Introducing refine.bio examples. Here, users can access a variety of example analyses implemented in R, such as clustering and heat maps, differential expression analysis, and pathway analysis, for use with refine.bio data.
The workshop will take place on November 1-5, 2021 from noon to 5pm eastern. Each day consists of lectures and designated time for attendees to work on exercise materials and their own projects with our staff available for consultation.
I work at the Childhood Cancer Data Lab, where we use very big data to find cures for childhood cancers. To move data around the internet at very high speeds, we are forced to use a proprietary software suite called Aspera. If somebody could make a Free Software alternative, the future of the internet would be way more awesome! Best of all, you can be the one to do it!
When my daughter Alex was diagnosed with cancer and throughout her battle, we saw how our community of people rallied around our family. No one knew quite how to help, but they were willing to do whatever was needed to ease the burden we faced.
'Work smarter not harder’ is useless advice if you don’t know how to ‘work smarter’. But the Childhood Cancer Data Lab's work and processes may be the smartest I’ve ever had the pleasure of learning and adopting.
The Data Lab will hold our first virtual workshop of the year from March 14-18, 2022!In this workshop, we will introduce researchers studying pediatric cancer to the R programming language, the Tidyverse R packages for data science, single-cell RNA-seq data analysis, and pathway analyses.
At the Data Lab, we are big proponents of automating the boring stuff so we can spend more time thinking about the fun stuff. But how exactly do we do that, and what does it mean to automate the boring stuff?
November marked the final Childhood Cancer Data Lab training workshop for 2021. We held four week-long virtual workshops this year, teaching 88 researchers the data science skills they need to examine their own data.
Before working as a Data Scientist at the Childhood Cancer Data Lab, I spent time in my PhD and post-doctoral fellowship in two very different research environments. Each had their own unique way of doing research. I found that some things worked really well and others were not as successful.
333 E. Lancaster Ave, #414
Wynnewood, PA 19096 USA
© Childhood Cancer Data Lab